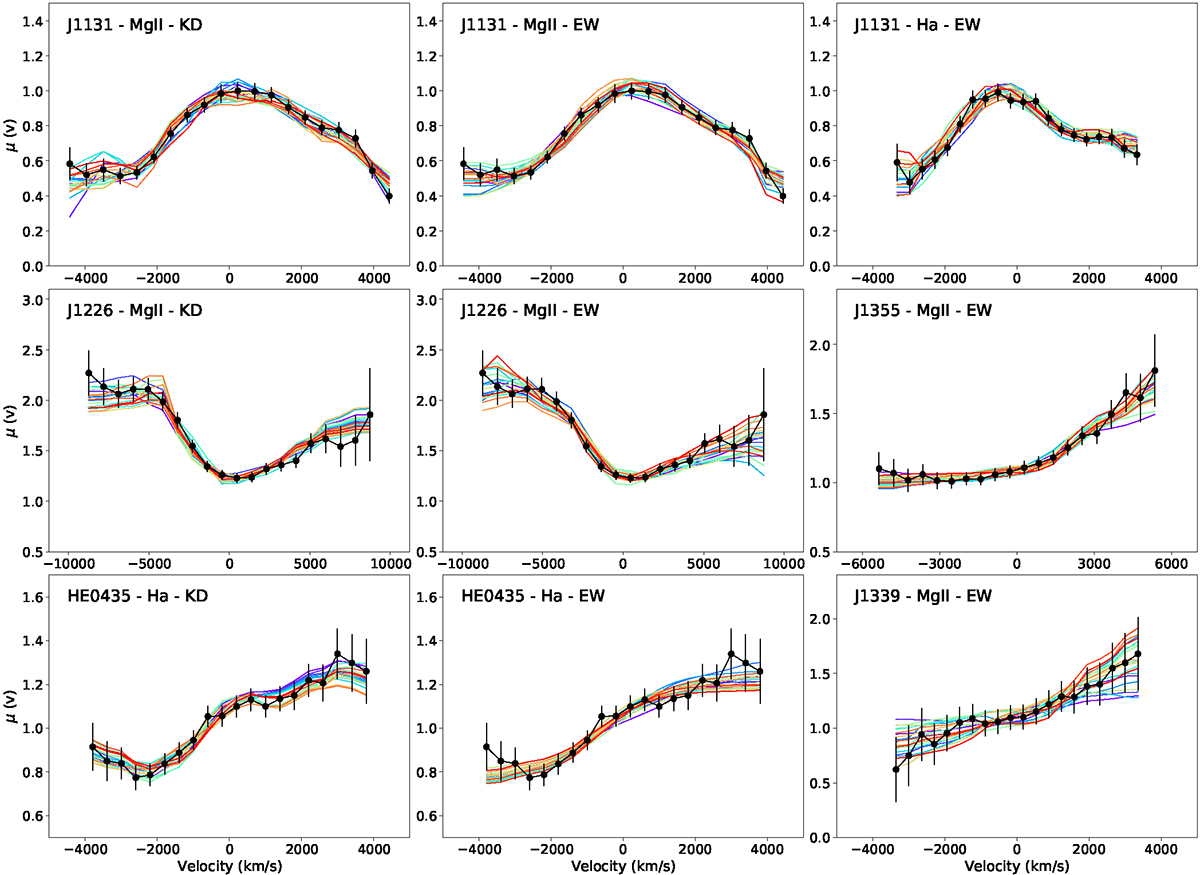
Fig. 3.
Download original image
Examples of 20 simulated μ(v) profiles (in color) that fit the μ(v) magnification profiles (in black) of the Mg II or Hα emission lines observed in J1131, J1226, J1355, J1339, and HE0435. The observed μ(v) profiles can be slightly different from those shown in Fig. 2 due to their resampling on the simulated profile velocity grid. The models are either EW or KD. The magnification maps with the smallest κ⋆/κ value were used. The maps are oriented at θ = 60° for EW models and θ = 0° for KD models, except for HE0435, where θ = 60° for KD and θ = 0° for EW (Table 3). In all models, i = 34°, q = 1.5, and rin = 0.1 rE.
Current usage metrics show cumulative count of Article Views (full-text article views including HTML views, PDF and ePub downloads, according to the available data) and Abstracts Views on Vision4Press platform.
Data correspond to usage on the plateform after 2015. The current usage metrics is available 48-96 hours after online publication and is updated daily on week days.
Initial download of the metrics may take a while.