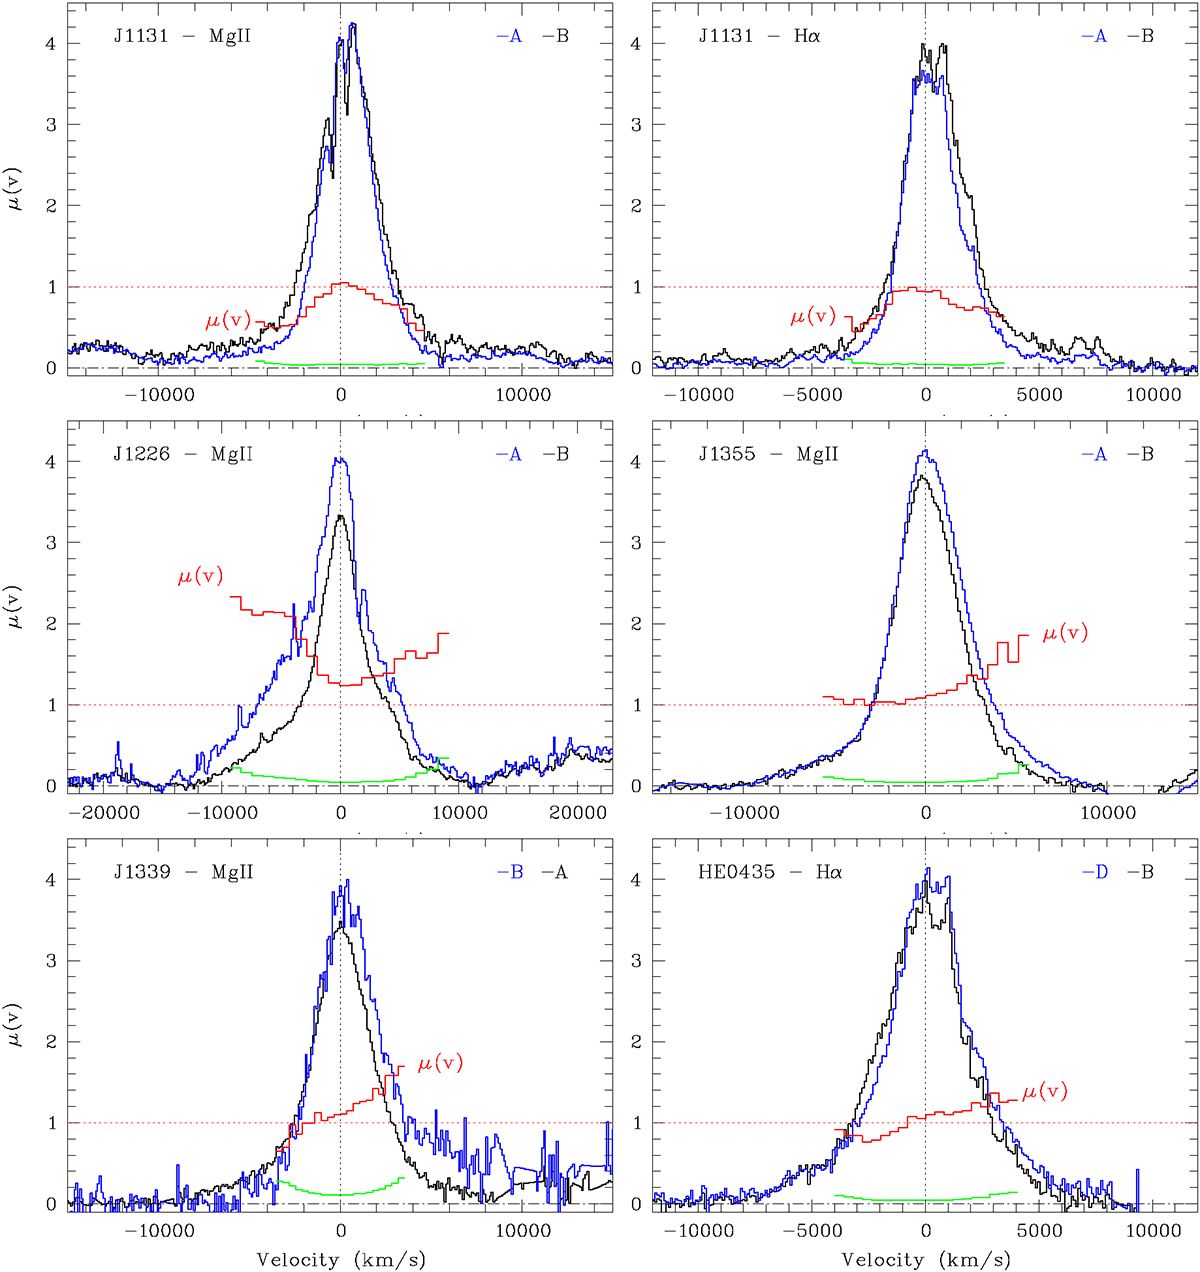
Fig. 2.
Download original image
μ(v) magnification profiles of the Mg II or Hα lines computed from simultaneously recorded spectra of two images of the quasars of our sample. The μ(v) profiles are shown in red, with the uncertainties in green. The superimposed line profiles from the microlensed image (in blue) and non-microlensed image (in black) were continuum-subtracted, corrected by the M factor, and arbitrarily rescaled. For the Mg II line profiles, the Fe II spectrum was subtracted using the Tsuzuki et al. (2006) template. The zero-velocity corresponds to the Mg IIλ2800 or Hα wavelengths at the source redshift.
Current usage metrics show cumulative count of Article Views (full-text article views including HTML views, PDF and ePub downloads, according to the available data) and Abstracts Views on Vision4Press platform.
Data correspond to usage on the plateform after 2015. The current usage metrics is available 48-96 hours after online publication and is updated daily on week days.
Initial download of the metrics may take a while.