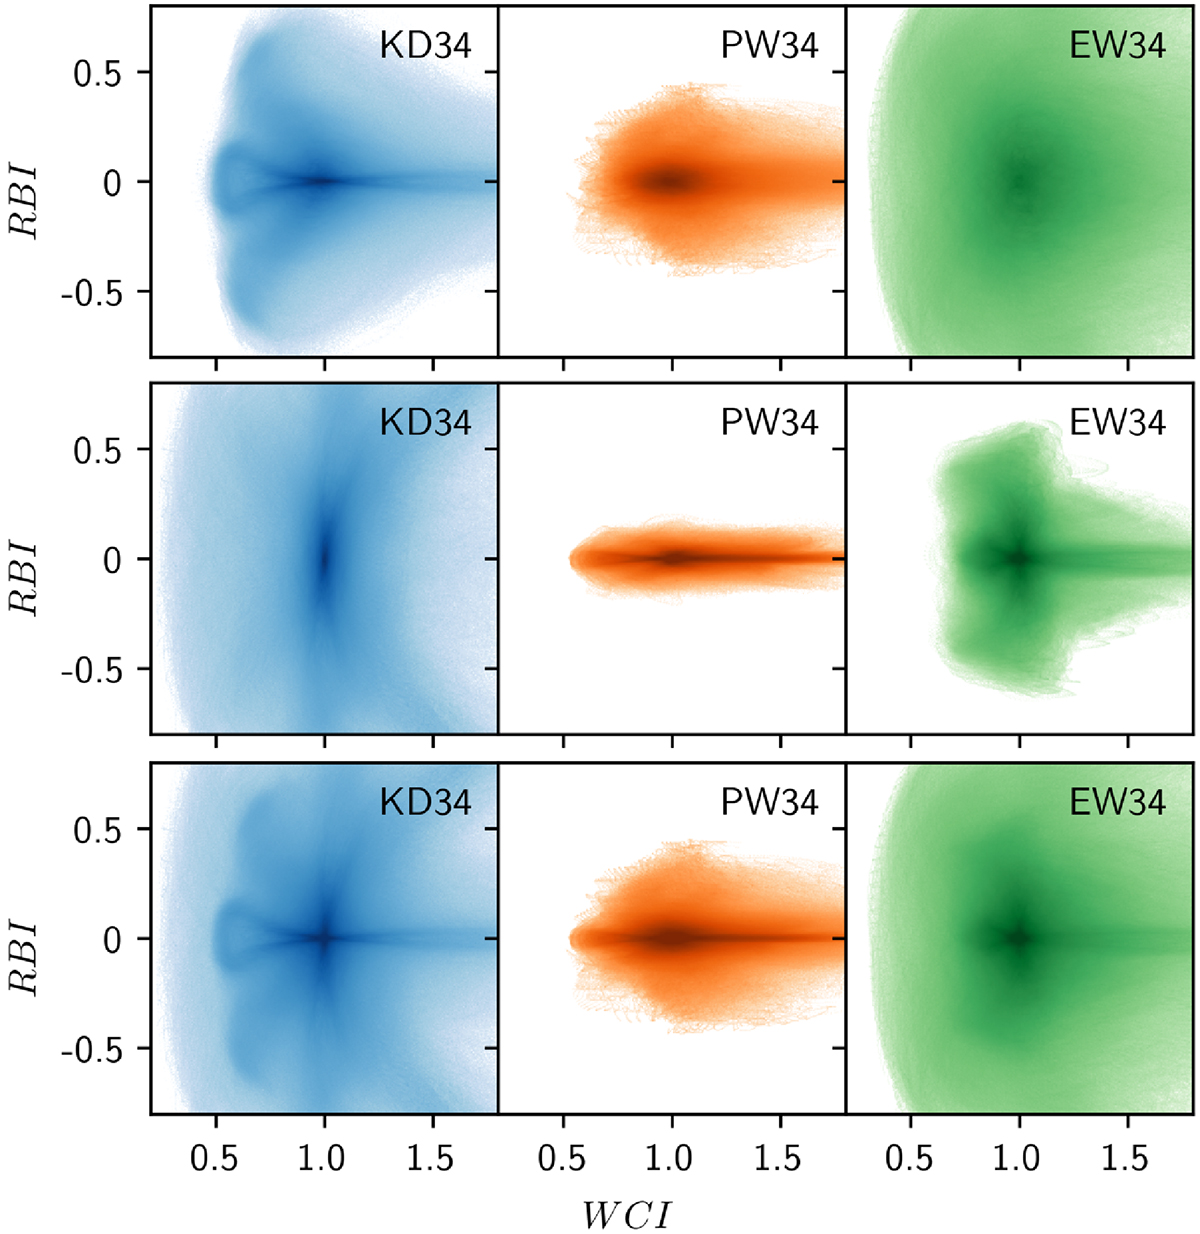
Fig. A.2.
Download original image
Two-dimensional histograms of simulated WCI and RBI (the darkest regions correspond to the highest frequencies). These indices were measured from simulated line profiles that arise from the BLR models KD, PW, and EW seen at an inclination of 34°, and with an emissivity ε = ε0 (rin/r)3. The simulations include the map orientations θ = [0°, 30°] (top panel), θ = [60°, 90°] (middle panel), and θ = [0°, 30°, 60°, 90°] (bottom panel) which is the combination of the top and middle panels. These histograms were built from the magnification maps used for the analysis of J1004+4112 (Hutsemékers et al. 2023). They show a particularly clear dependence on the map orientation. The simulations were restricted to 0.9 ≤ μBLR ≤ 1.1, and to a single value of the BLR size, rin = 0.1rE.
Current usage metrics show cumulative count of Article Views (full-text article views including HTML views, PDF and ePub downloads, according to the available data) and Abstracts Views on Vision4Press platform.
Data correspond to usage on the plateform after 2015. The current usage metrics is available 48-96 hours after online publication and is updated daily on week days.
Initial download of the metrics may take a while.