Fig. 3
Download original image
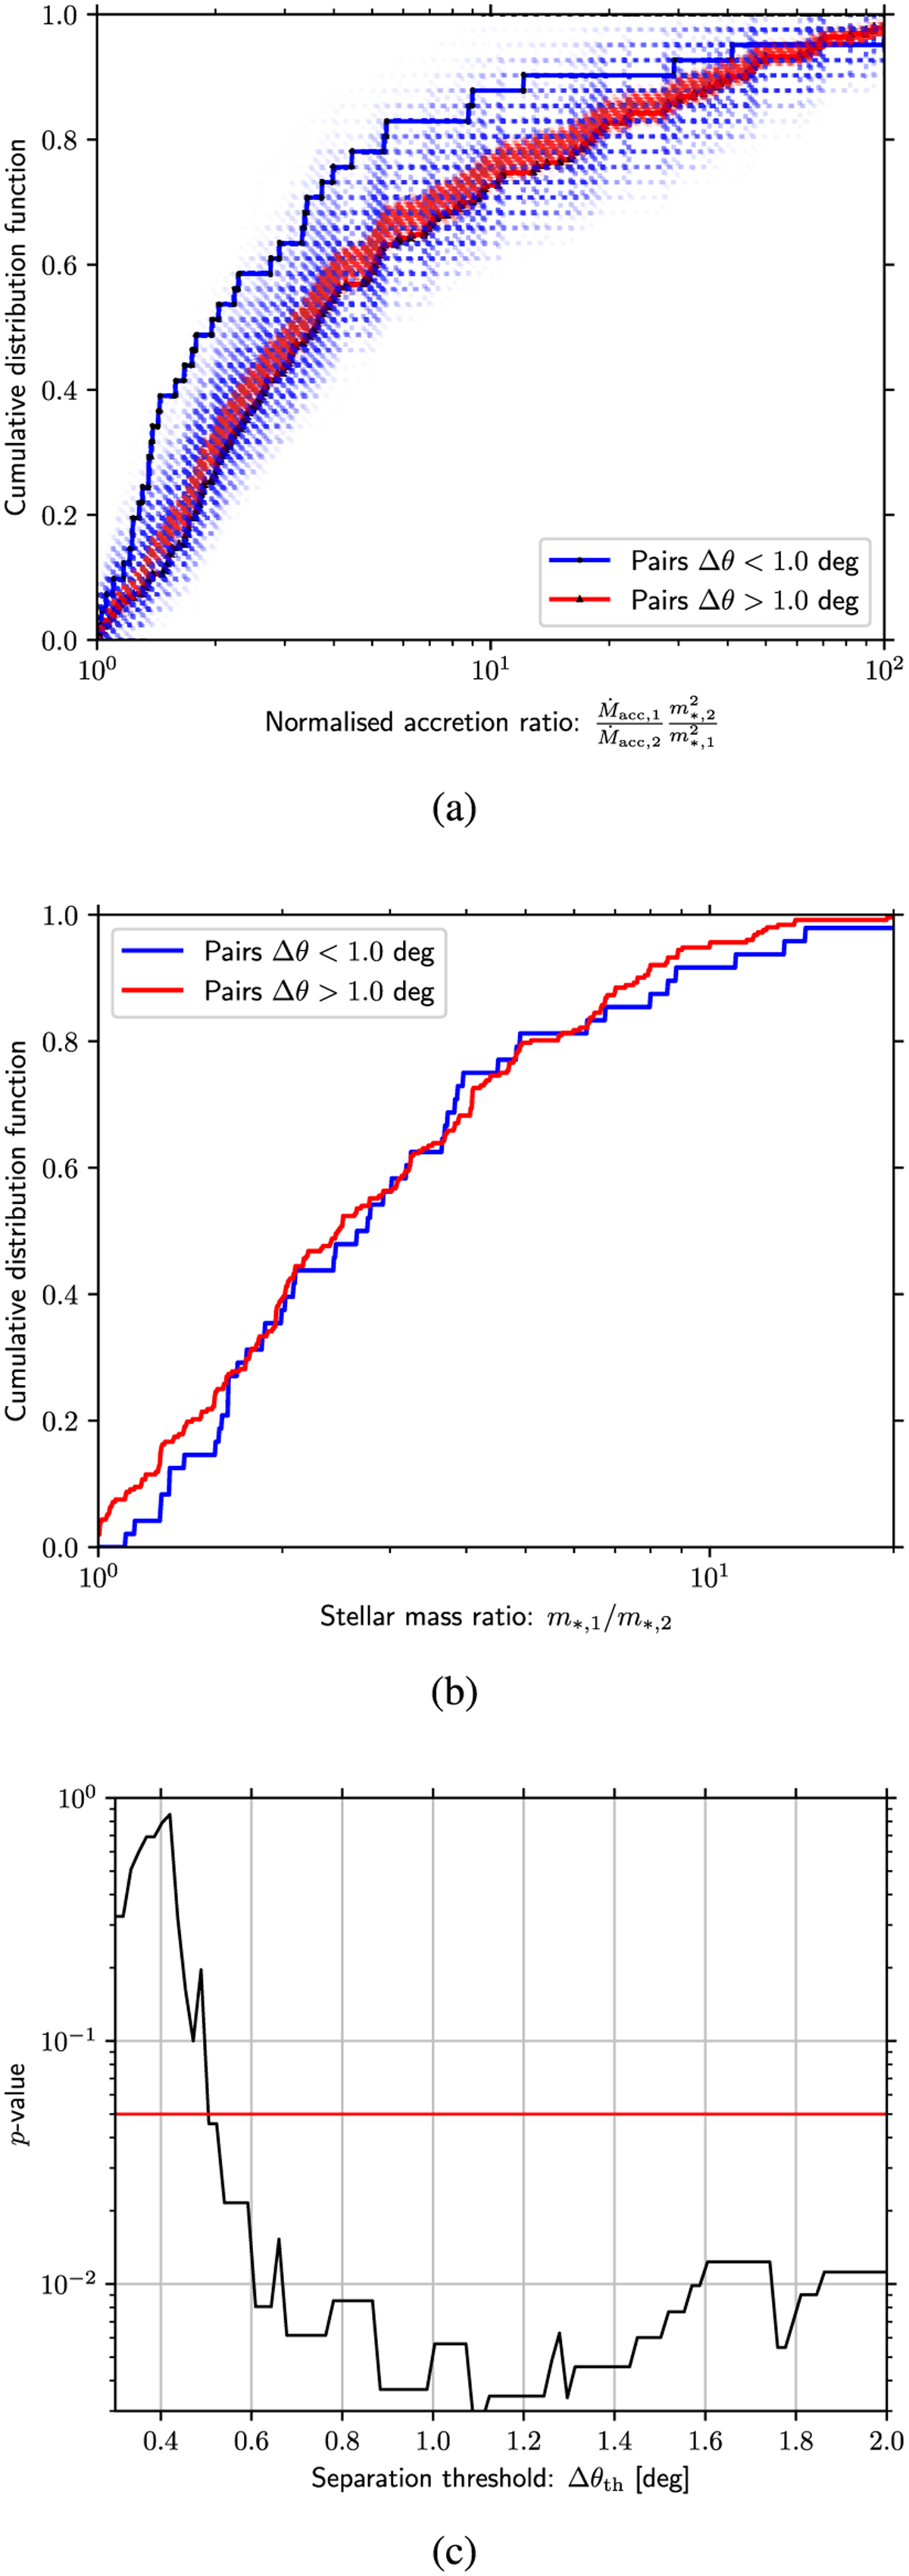
Outcome of the correlation experiment for the distributed stellar population across the Lupus cloud complex. Figure 3a shows the cumulative distribution function (CDF) of the ratio of normalised accretion rates between pairs separated by less than (blue) and more than (red) the threshold separation ∆θth = 1°. Faint blue and red points are bootstrapping experiments where we shuffle the normalised accretion rates between star locations. Figure 3b a similar CDF for stellar masses, which are not correlated. Figure 3c shows statistical significance as a function of the threshold ∆θth.
Current usage metrics show cumulative count of Article Views (full-text article views including HTML views, PDF and ePub downloads, according to the available data) and Abstracts Views on Vision4Press platform.
Data correspond to usage on the plateform after 2015. The current usage metrics is available 48-96 hours after online publication and is updated daily on week days.
Initial download of the metrics may take a while.