Fig. 2
Download original image
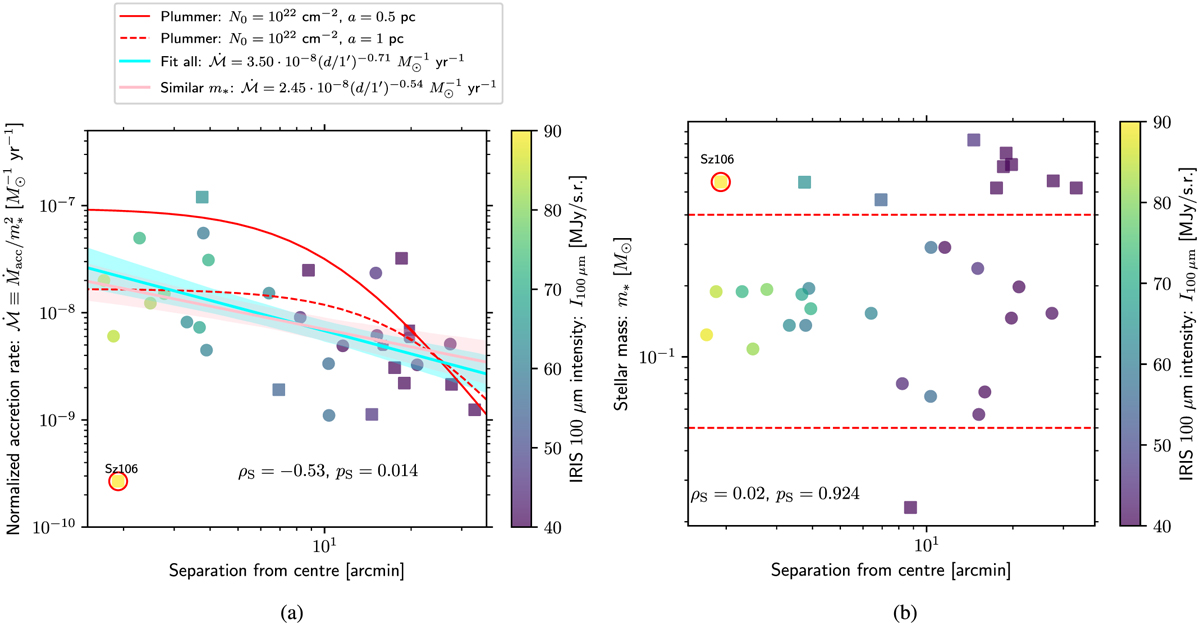
Distribution of normalised accretion rates (Figure 2a) and stellar masses (Figure 2b) as a function of the projected distance from the centre of our clustered sample, which is cut at 0.5°. Stars used to calculate correlation coefficients are marked as circles, while excluded stars are shown as squares. The latter lie outside the mass limits shown as horizontal dashed red lines in Figure 2b. All points are coloured by the local 100 µm intensity. Figure 2a also shows the outcome of fitting a power-law to the full sample (cyan) and the stellar mass restricted sample (pink). We also show the estimated rate of BHL accretion based on two Plummer models (red lines, see Section 3.1 for details). We highlight with a red circle Sz 106, which is an outlier and sub-luminous star (see Section 3.4).
Current usage metrics show cumulative count of Article Views (full-text article views including HTML views, PDF and ePub downloads, according to the available data) and Abstracts Views on Vision4Press platform.
Data correspond to usage on the plateform after 2015. The current usage metrics is available 48-96 hours after online publication and is updated daily on week days.
Initial download of the metrics may take a while.