Fig. 1
Download original image
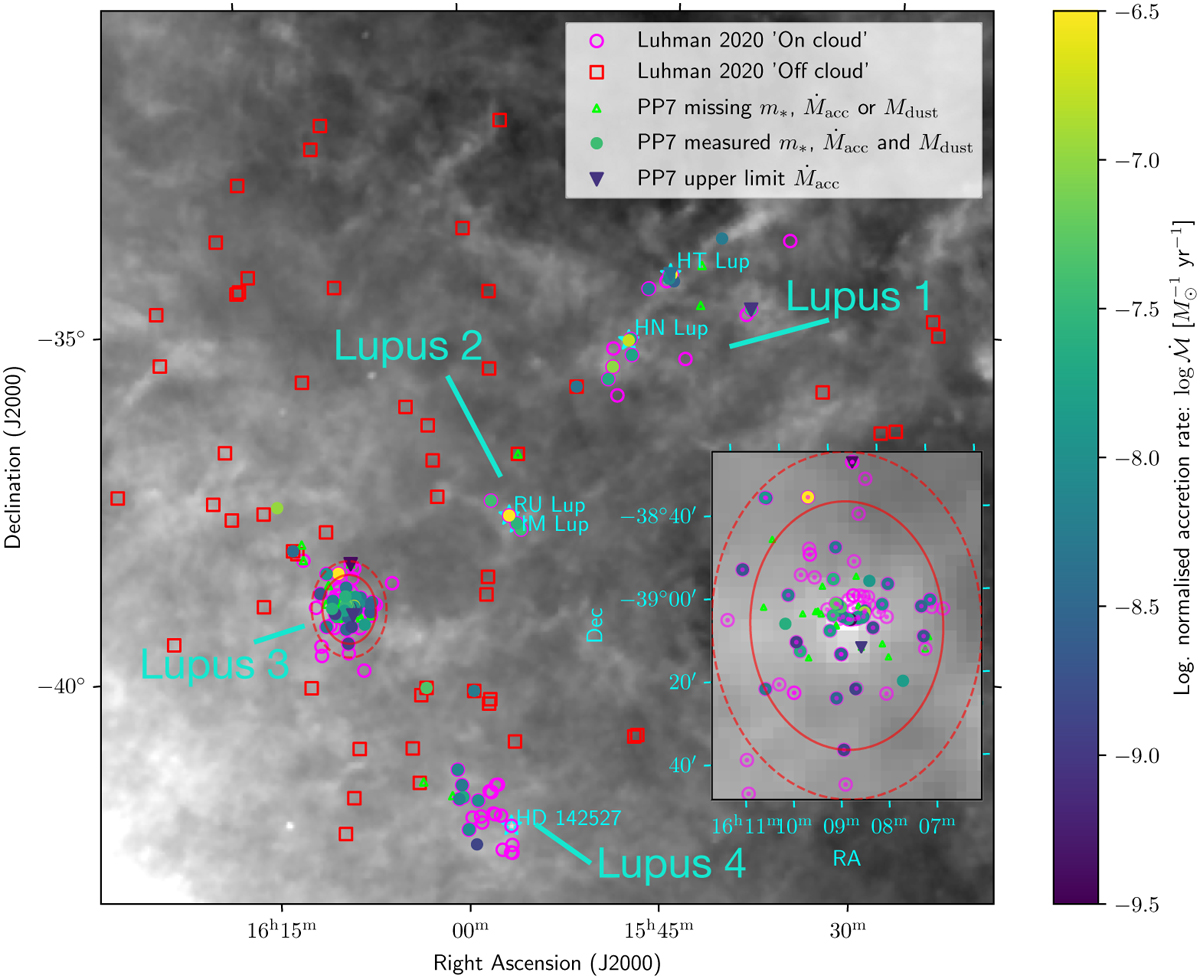
Distribution of candidate Lupus members with Gaia kinematics as identified by Luhman (2020), which we show as hollow shapes (fuchsia circles the ‘on cloud’ sample that coincide with Lupus 1–4, and red squares are the ‘off cloud’ sample). The locations of stars with discs included in the PP7 catalogue of Manara et al. (2023) but without measurements of stellar mass, accretion rate or disc dust mass are shown as lime triangles. Those stars that have stellar masses, dust masses and accretion rates recorded by Manara et al. (2023) are shown as filled coloured circles (or downward triangles for upper limits in accretion rate) that represent the normalised accretion rate according to the colour bar. The greyscale overlay is the IRIS 100 µm map of the region (Miville-Deschênes & Lagache 2005). We mark with cyan stars and labels the locations of systems that exhibit some evidence of interaction with the ISM or high levels of outer disc turbulence, discussed in Section 3.5. We also show a zoom-in on a region centred on Lupus 3, which we define as the ‘clustered’ region (inside the solid red ellipse). Within this circle, we show the ‘on cloud’ sample with fuchsia circles and inner points to make the sample clear in the crowded central region.
Current usage metrics show cumulative count of Article Views (full-text article views including HTML views, PDF and ePub downloads, according to the available data) and Abstracts Views on Vision4Press platform.
Data correspond to usage on the plateform after 2015. The current usage metrics is available 48-96 hours after online publication and is updated daily on week days.
Initial download of the metrics may take a while.