Fig. 2
Download original image
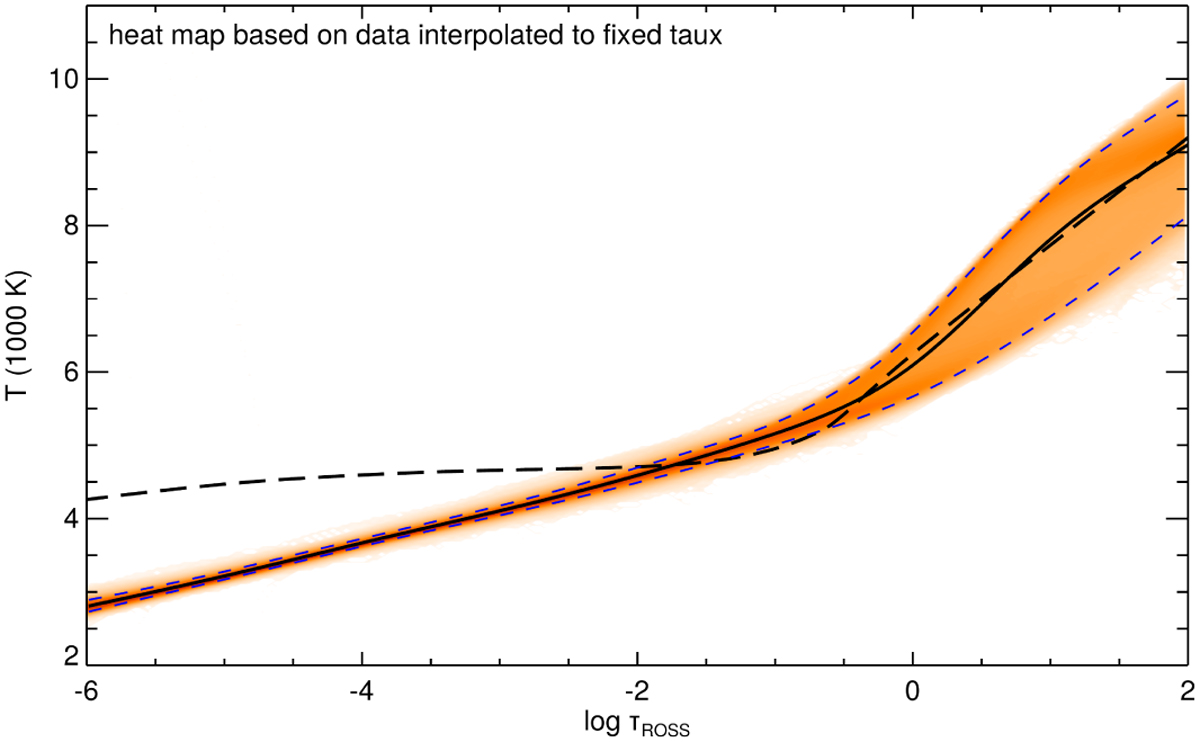
Three-dimensional versus 1D temperature structure for stellar parameters Teff=5773 K, log ɡ=4.7, and metallicity [M/H]=−4.0. The orange band outlines the 3D temperature distribution of the high-resolution model resampled to 70 × 70 × 160 grid points. The width of the temperature distribution encountered on surfaces of equal Rosse-land optical depth is indicated by the dashed blue lines enclosing 95.5% of the data points at each height. The solid black line shows the average temperature of the 3D model, the long-dashed black line represents the T(τRoss) relation predicted by a 1D model atmosphere with identical stellar parameters, treating convection by standard mixing-length theory, but otherwise using the same input physics as the 3D hydrodynamical model.
Current usage metrics show cumulative count of Article Views (full-text article views including HTML views, PDF and ePub downloads, according to the available data) and Abstracts Views on Vision4Press platform.
Data correspond to usage on the plateform after 2015. The current usage metrics is available 48-96 hours after online publication and is updated daily on week days.
Initial download of the metrics may take a while.