Open Access
Fig. 11
Download original image
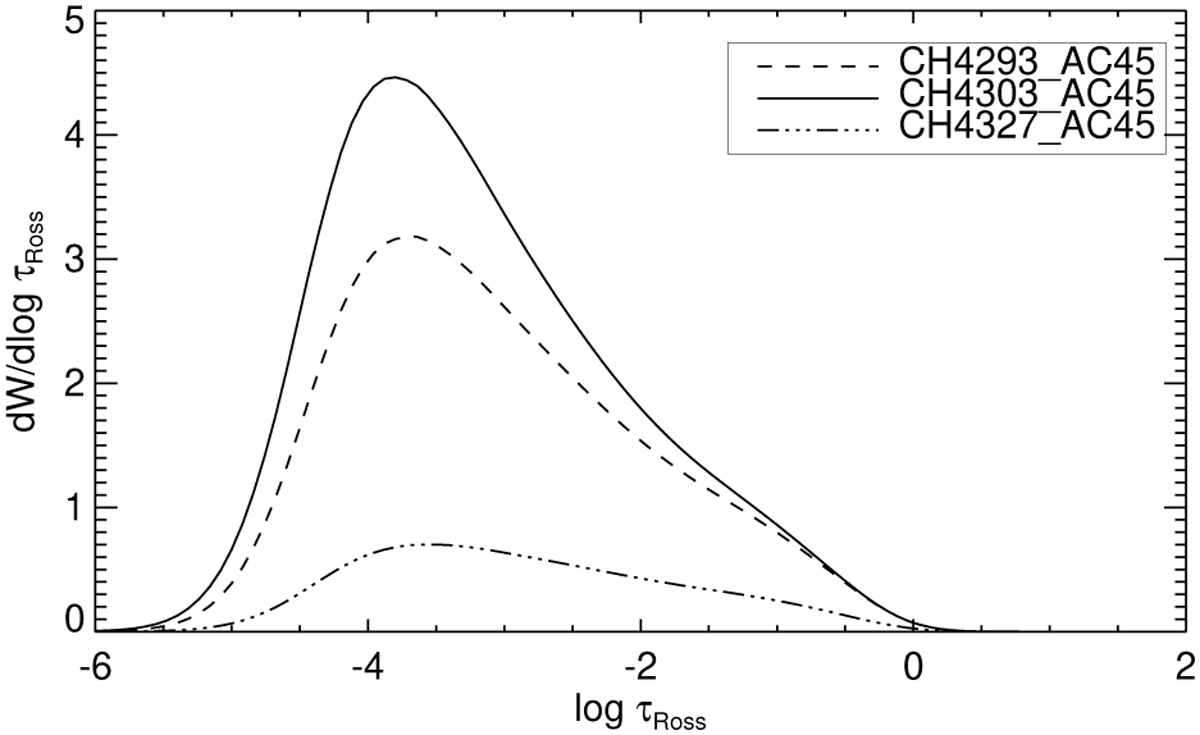
EW contribution function, dW/d log τRoss for three of the strongest CH features in the G-band, located at 4293 Å (dashed), 4303 Å (solid), and 4327 A (dash-dotted), respectively, as computed from the 3D model shown in Fig. 2. The area under each curve gives the line’s EW in mÅ for the disk-integrated stellar spectrum.
Current usage metrics show cumulative count of Article Views (full-text article views including HTML views, PDF and ePub downloads, according to the available data) and Abstracts Views on Vision4Press platform.
Data correspond to usage on the plateform after 2015. The current usage metrics is available 48-96 hours after online publication and is updated daily on week days.
Initial download of the metrics may take a while.