Fig. 6.
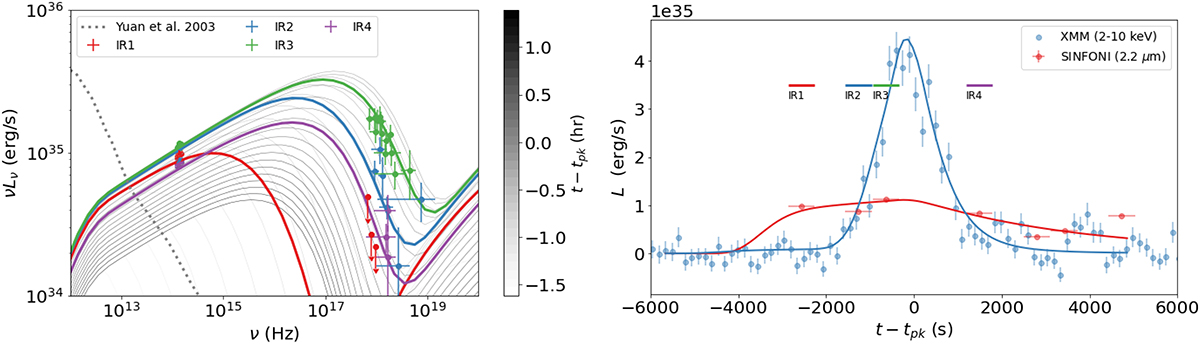
Download original image
Application of the model to the 2014 nonthermal flare from Sgr A⋆. Left panel: SED evolution during the 2014 bright flare of Sgr A⋆ (symbols). Snapshots of model spectra (every tcr is plotted with thin gray lines). The thick lines represent the average model spectra during the four observation time windows. Right panel: NIR and X-ray model light curves (solid lines) plotted against the data of the 2014 flare (symbols). After the peak time of the flare, the particles escape from the active region on a timescale 12.5 R/c. The data are adopted from Ponti et al. (2017).
Current usage metrics show cumulative count of Article Views (full-text article views including HTML views, PDF and ePub downloads, according to the available data) and Abstracts Views on Vision4Press platform.
Data correspond to usage on the plateform after 2015. The current usage metrics is available 48-96 hours after online publication and is updated daily on week days.
Initial download of the metrics may take a while.