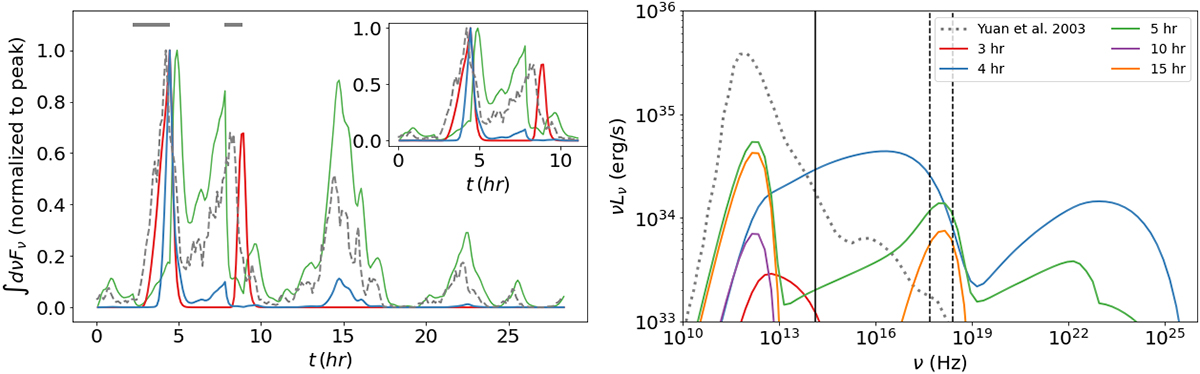
Fig. 4.
Download original image
Light curves and spectra of a nonthermal flare computed for a variable particle injection rate. Left panel: Light curves at different energies (500 GHz: green; NIR: red; X-rays: blue) computed for a variable injection rate Q0 that mimics red noise (dashed gray line). All other parameters are the same as in Table 1. Two episodes of acceleration are assumed to take place and are indicated by the horizontal bars. The time series in the left panel are normalized to their peak values, and a zoom in the first 10 h is shown in the inset plot. The light curves do not account for the background flux arising from the accretion flow. Right panel: SED snapshots of our model. For comparison, the quiescent emission model of Yuan et al. (2003) is also shown (dotted curve). An animation of the full temporal evolution of the broadband spectra can be found at this link.
Current usage metrics show cumulative count of Article Views (full-text article views including HTML views, PDF and ePub downloads, according to the available data) and Abstracts Views on Vision4Press platform.
Data correspond to usage on the plateform after 2015. The current usage metrics is available 48-96 hours after online publication and is updated daily on week days.
Initial download of the metrics may take a while.