Fig. 3.
Download original image
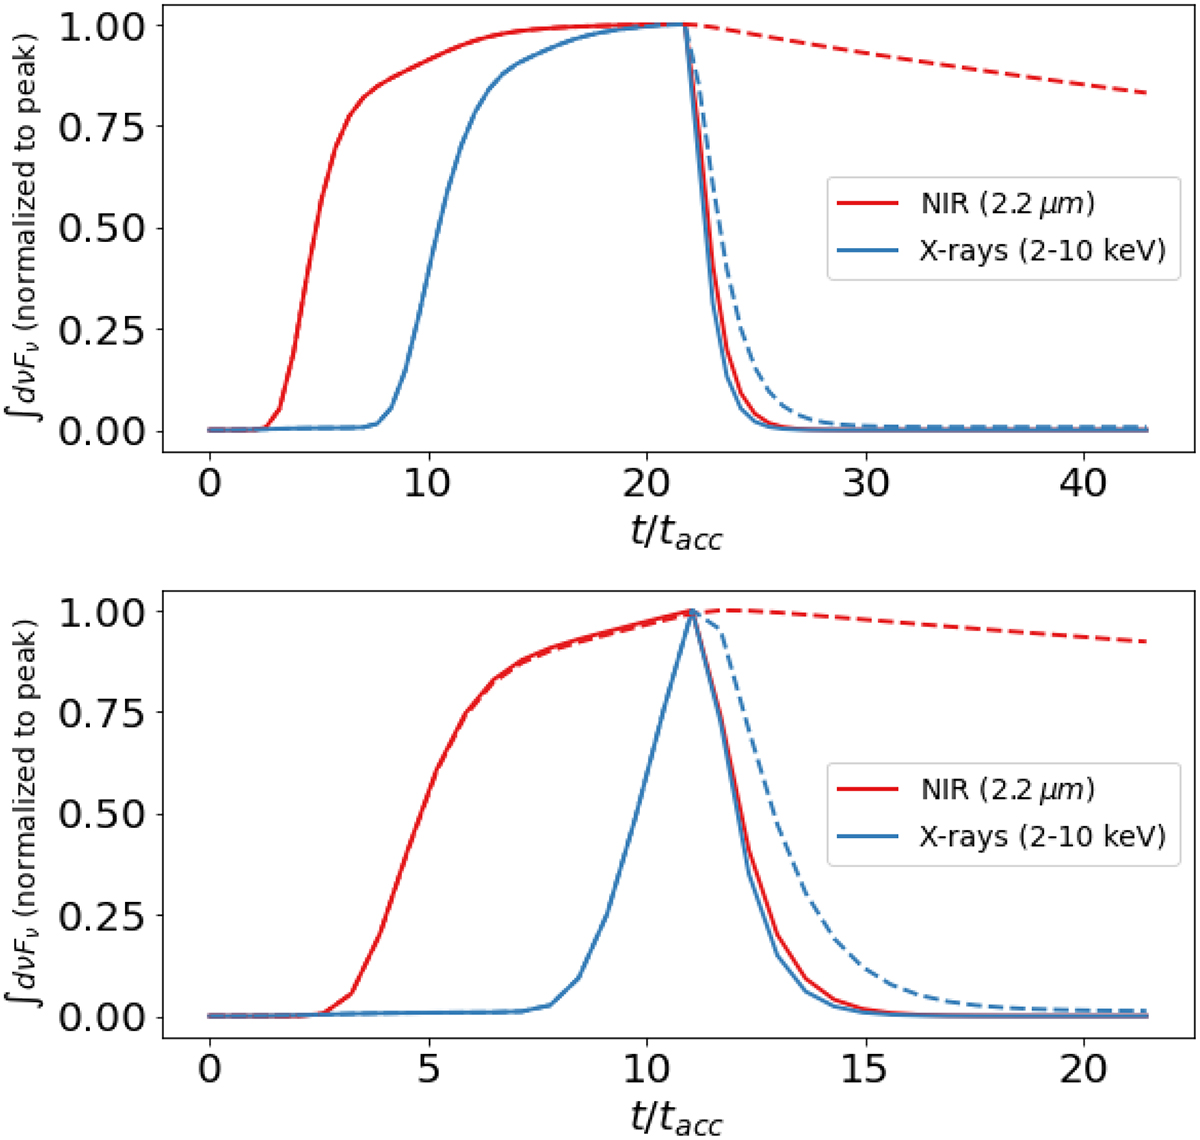
Light curves of an NIR and X-ray flare for two different choices of the particle acceleration duration. Top panel: NIR and X-ray light curves for the same flare as in Figs. 1 and 2, but also accounting for the decay phase. We show the results for two choices of the particle escape timescale during the decay: ![]() (solid lines) and
(solid lines) and ![]() (dashed lines). Bottom panel: Same as in the top panel, but for an acceleration episode lasting 10 tacc.
(dashed lines). Bottom panel: Same as in the top panel, but for an acceleration episode lasting 10 tacc.
Current usage metrics show cumulative count of Article Views (full-text article views including HTML views, PDF and ePub downloads, according to the available data) and Abstracts Views on Vision4Press platform.
Data correspond to usage on the plateform after 2015. The current usage metrics is available 48-96 hours after online publication and is updated daily on week days.
Initial download of the metrics may take a while.