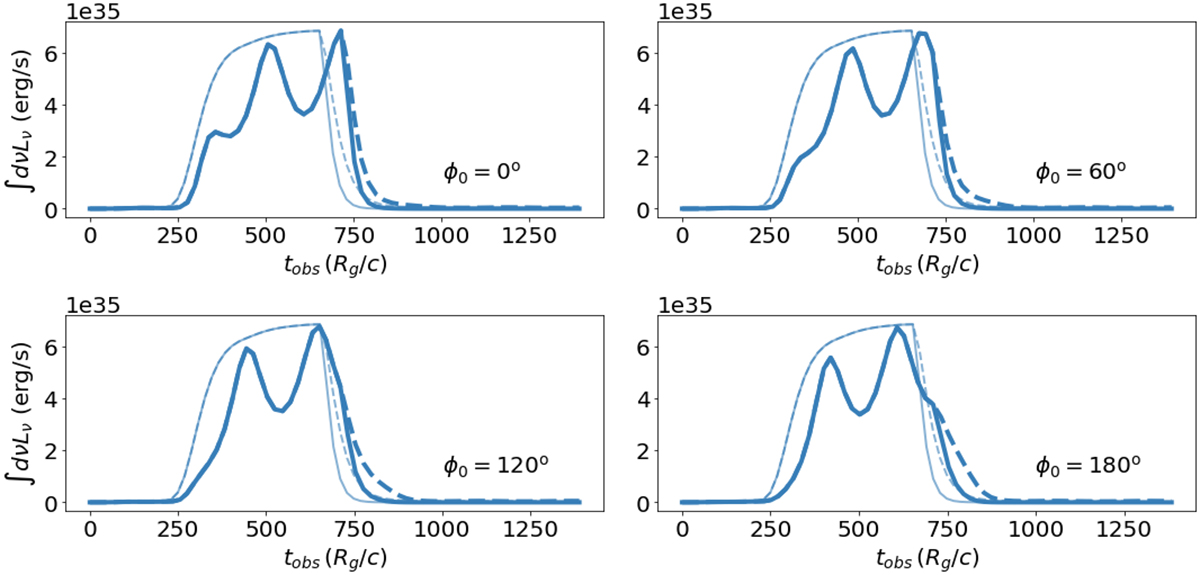
Fig. A.5.
Download original image
X-ray (2-10 keV) light curves (thick lines) computed for a blob moving on a conical spiral trajectory, starting from different initial azimuth angles (see inset legends). The observer is located at θobs = 168o in the y − z plane – see also Fig. A.4. Thin lines show the light curves without the Doppler boosting effects, as in Fig. 3.
Current usage metrics show cumulative count of Article Views (full-text article views including HTML views, PDF and ePub downloads, according to the available data) and Abstracts Views on Vision4Press platform.
Data correspond to usage on the plateform after 2015. The current usage metrics is available 48-96 hours after online publication and is updated daily on week days.
Initial download of the metrics may take a while.