Fig. 1.
Download original image
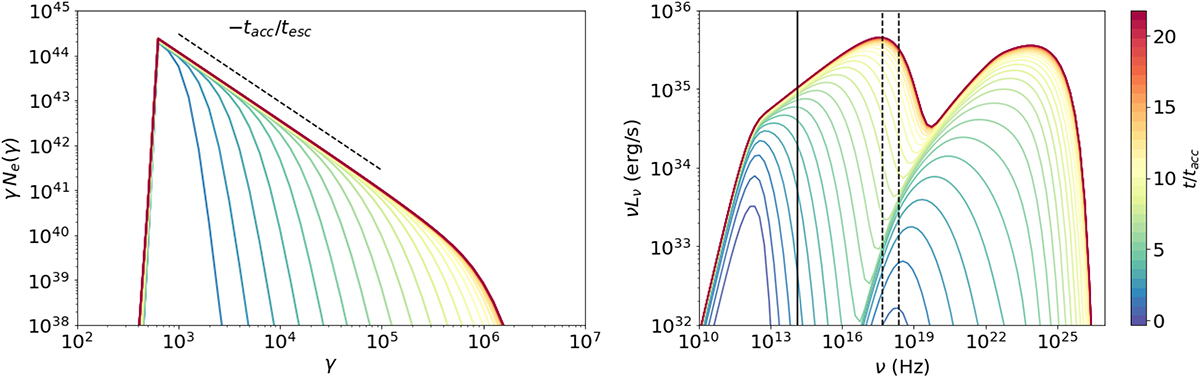
Temporal evolution of the electron distribution Ne(γ) multiplied by γ (left panel) and of the emitted SSC spectra (right panel) during a particle acceleration episode for the parameters listed in Table 1. The colors indicate different times (in units of tacc; see the color bar). The dashed line in the left panel shows the model-predicted slope for the electron distribution. The vertical solid and dashed lines in the right panel indicate the characteristic NIR (2.2 μm) and X-ray (2–10 keV) frequencies, respectively.
Current usage metrics show cumulative count of Article Views (full-text article views including HTML views, PDF and ePub downloads, according to the available data) and Abstracts Views on Vision4Press platform.
Data correspond to usage on the plateform after 2015. The current usage metrics is available 48-96 hours after online publication and is updated daily on week days.
Initial download of the metrics may take a while.