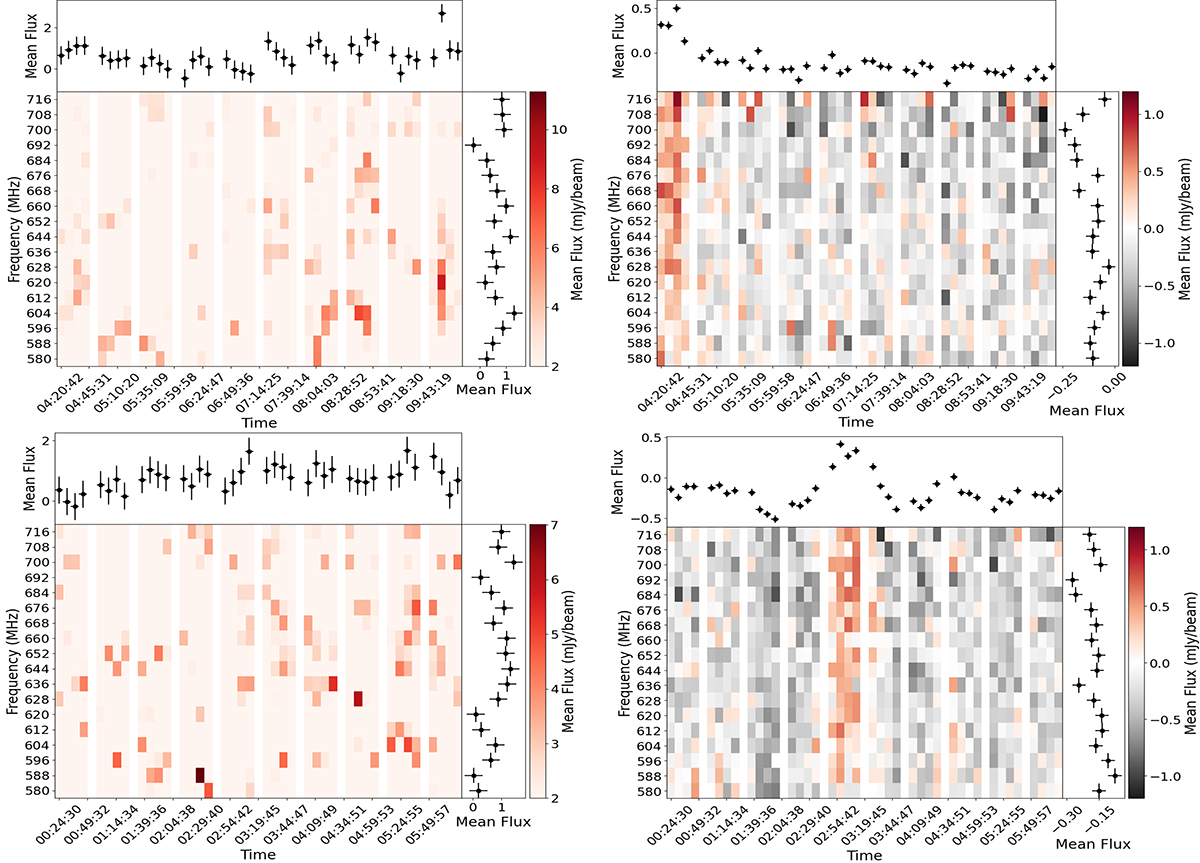
Fig. C.1.
Download original image
Dynamic spectrum of Stokes I (left) and Stokes V (right) emission for June (top) and July (bottom) observations. Each bin corresponds to an integration time of 7 minutes averaged over 40 channels (∼8 MHz), a good compromise between resolution and S/N per bin. The average rms for each bin in Stokes I is ∼2 mJy/beam, while it is ∼0.32 mJy/beam for Stokes V. The narrow white gaps mark the time spent on the phase calibrator during the observation. In each panel, the top and right subsets show the time series and the average spectra, obtained by integrating the dynamic spectrum in frequency and time, respectively.
Current usage metrics show cumulative count of Article Views (full-text article views including HTML views, PDF and ePub downloads, according to the available data) and Abstracts Views on Vision4Press platform.
Data correspond to usage on the plateform after 2015. The current usage metrics is available 48-96 hours after online publication and is updated daily on week days.
Initial download of the metrics may take a while.