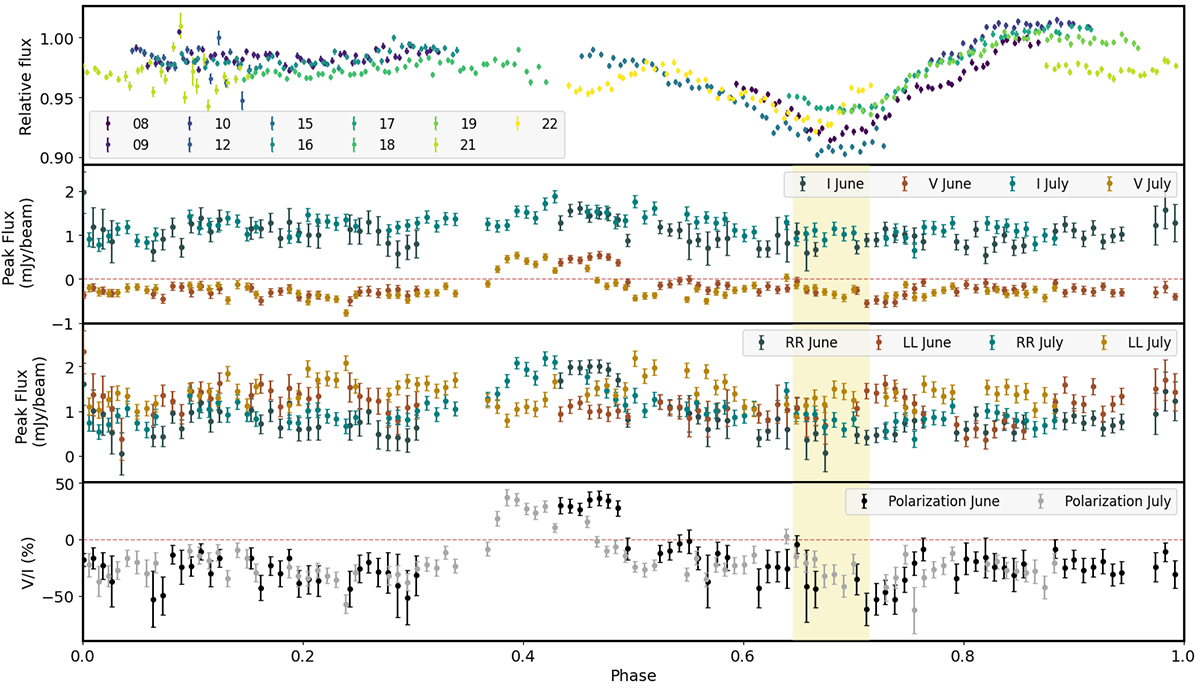
Fig. 2.
Download original image
Phase-aligned optical and radio light curves of J0508−21, assuming P = 0.280455 days and taking the beginning of the first target scan in the July uGMRT observation, T0(JD) = 2460154.51215, as the reference phase (ϕ = 0). Top panel: Optical i-band fluxes from the 40 cm camera of LCOGT, with colors marking different days of the March 2023 campaign (see Appendix B for details). Second panel: Radio light curves (Stokes I in green, Stokes V in brown) of the 2023 uGMRT observations in June (darker shades) and July (lighter shades). Each horizontal point represents the peak flux integrated over 3.5 minutes, in band 4 (575−720 MHz). The vertical error bars represent the statistical error 1σrms for each time binning. Third panel: RR (brown) and LL (green) components for June and July observations, with the same color-code as the top panel. Bottom panel: Circular polarization fraction V/I, where we have excluded a few points with a very large (∼100%) relative error. The yellow-shaded phase range indicates the expected location of the main optical dip at its minimum, as extrapolated from the LCOGT observations (Bejar et al., in prep.) and with the assumed timing solution. Its width indicates the phase error of the dip center, obtained by propagating the estimated error on the period σP ∼ 0.000035 days.
Current usage metrics show cumulative count of Article Views (full-text article views including HTML views, PDF and ePub downloads, according to the available data) and Abstracts Views on Vision4Press platform.
Data correspond to usage on the plateform after 2015. The current usage metrics is available 48-96 hours after online publication and is updated daily on week days.
Initial download of the metrics may take a while.