Fig. 1.
Download original image
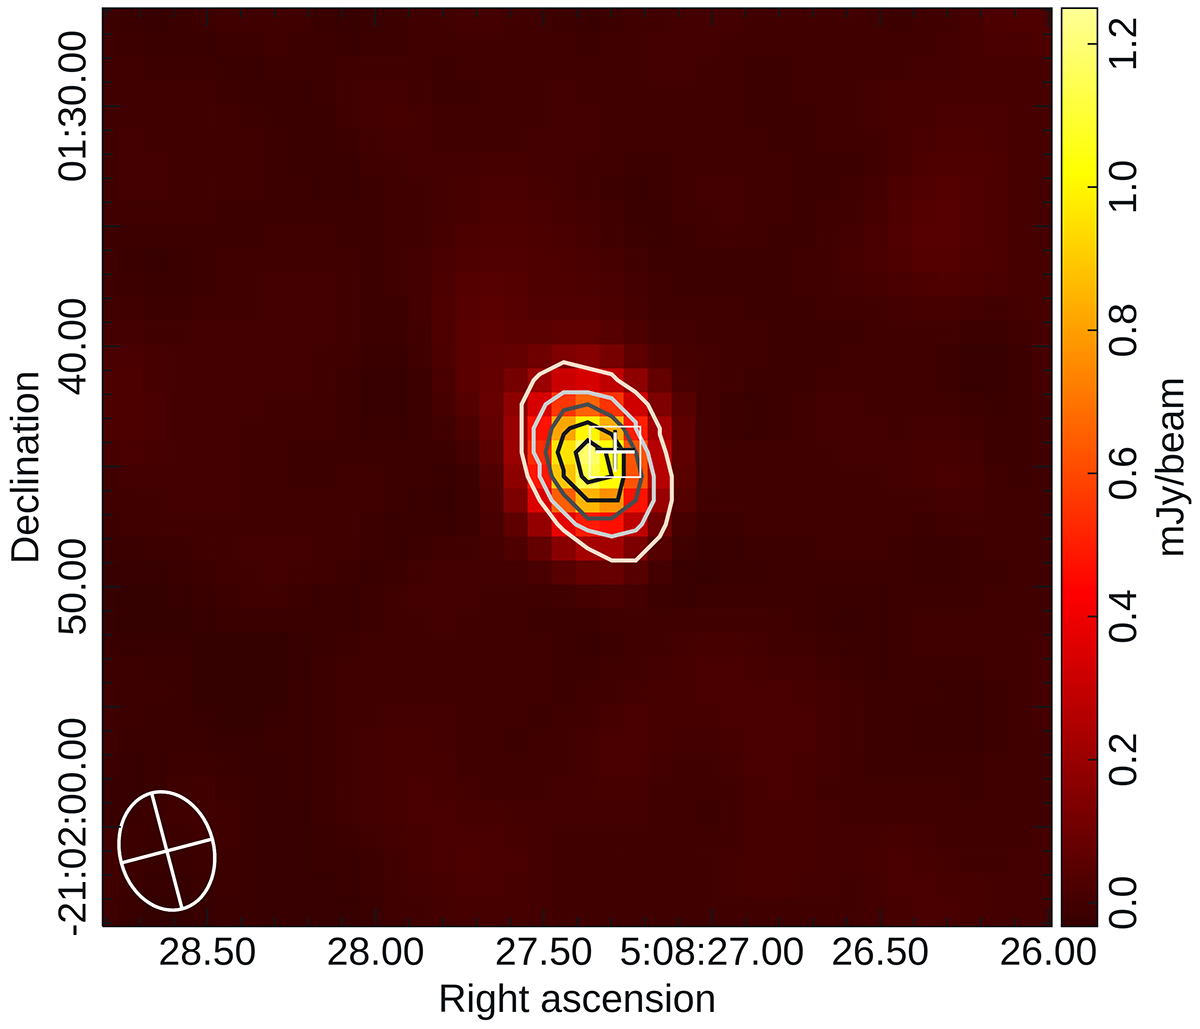
Combined map for the June and July uGMRT radio observations centered on J0508−21. The color scale represents the Stokes I flux density, while the contours indicate the Stokes V signal, corresponding to levels of 5, 10, 15, 20, and 25 σrmsV (where σrmsV is ∼6.5 μJy/beam). The synthesized beam is shown in the lower-left corner, and the cross marks the position of the target.
Current usage metrics show cumulative count of Article Views (full-text article views including HTML views, PDF and ePub downloads, according to the available data) and Abstracts Views on Vision4Press platform.
Data correspond to usage on the plateform after 2015. The current usage metrics is available 48-96 hours after online publication and is updated daily on week days.
Initial download of the metrics may take a while.