Fig. 8.
Download original image
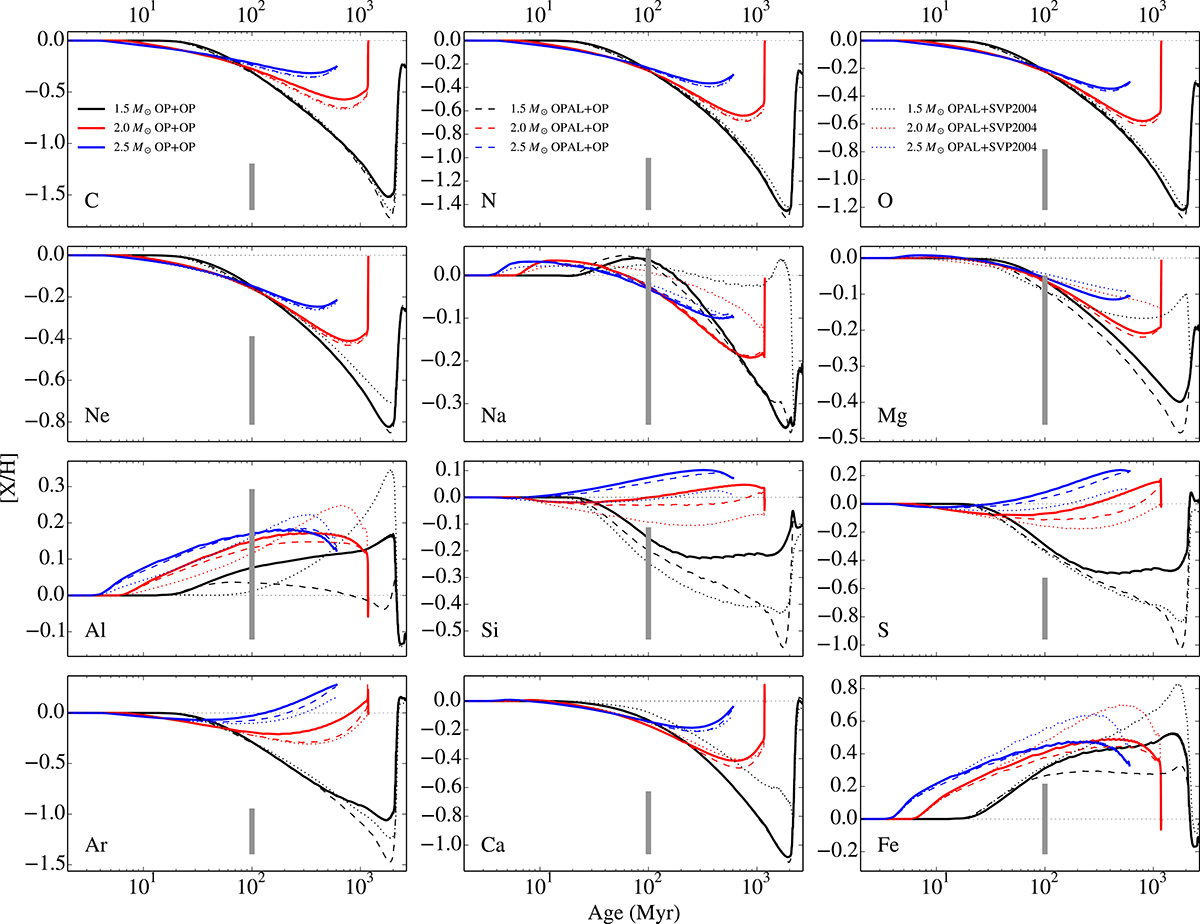
Abundance evolutions obtained with OP and OPAL opacity calculations for the three masses studied (1.5, 2, and 2.5 M⊙, represented with black, red, and blue lines, respectively). The reference model used OP opacities along with OP grad (thick solid lines, ‘OP+OP’). The runs using OPAL opacities and OP or SVP2004 grad are shown with dashed (‘OPAL+OP’) or dotted (‘OPAL+SVP2004’) lines, respectively. The thin dotted line and the grey bar have the same meaning as in Figs. 5 to 7.
Current usage metrics show cumulative count of Article Views (full-text article views including HTML views, PDF and ePub downloads, according to the available data) and Abstracts Views on Vision4Press platform.
Data correspond to usage on the plateform after 2015. The current usage metrics is available 48-96 hours after online publication and is updated daily on week days.
Initial download of the metrics may take a while.