| Issue |
A&A
Volume 610, February 2018
|
|
|---|---|---|
| Article Number | L15 | |
| Number of page(s) | 5 | |
| Section | Letters to the Editor | |
| DOI | https://doi.org/10.1051/0004-6361/201832706 | |
| Published online | 27 February 2018 | |
Letter to the Editor
Role of atomic diffusion in the opacity enhancement inside B-type stars
IRAP, Université de Toulouse, CNRS, UPS, CNES,
Toulouse, France
e-mail: This email address is being protected from spambots. You need JavaScript enabled to view it.
Received:
25
January
2017
Accepted:
3
February
2018
Abstract
Context. The pulsation frequencies of early B-type stars cannot be reproduced using stellar models with homogeneous abundances. A suitable match requires a dedicated enhancement of the opacity in the layers where its main contributors are the iron-peak elements (the so-called Z-bump), which trigger the oscillations in these stars.
Aim. Our aim is to test whether the abundance stratification induced by atomic diffusion in these stellar layers is able to modify the local opacity as needed to account for the asteroseismic observations.
Methods. Models representing a typical pulsating B-star were evolved during the main sequence using the Toulouse–Geneva evolution code in an improved version. The migration of the chemicals involves radiative accelerations, which were computed with the single-valued parameter method, and fingering mixing with parameters constrained by three-dimensional simulations. The possible effect of mass-loss was also considered.
Results. We show that atomic diffusion modifies the abundance profiles inside the star, leading to an overabundance of the iron-peak elements in the upper part of the envelope. The opacities may become as high as required, provided that fingering mixing, which extends the size of the overabundance zone, is taken into account. A zero-flux of the elements at the surface leading to unphysical accumulations, mass-loss is also required to evolve the model until the end of the main sequence.
Key words: stars: interiors / stars: oscillations / diffusion / stars: abundances
© ESO 2018
 Open Access article, published by EDP Sciences, under the terms of the Creative Commons Attribution License (http://creativecommons.org/licenses/by/4.0;), which permits unrestricted use, distribution, and reproduction in any medium, provided the original work is properly cited.
1 Introduction
A large number of early B-type stars show oscillations, gravity as well as pressure modes, triggered by the κ-mechanism involving iron-peak elements (Daszyńska-Daszkiewicz et al. 2017, and references therein). However, reconciling the observed and computed frequencies requires an increase in opacity in the layers where the iron-peak elements are the main contributors of this opacity (the so-called Z-bump). Two main research axes are currently under investigation to try solving this question: first, the opacity of iron-peak elements may be underestimated in current datasets (Turck-Chièze et al. 2016), as suggested by laboratory experiments on iron (Bailey et al. 2015); second, the opacity could be increased by a local overabundance of iron peak elements (Pamyatnykh et al. 2004). In a pioneering work, Bourge & Alecian (2006) suggested that this overabundance could result from radiative diffusion inside the star. This result, however, was based on a rather simple diffusion model that ignored the feedback of the abundances on the radiative accelerations.
Here, we use the Toulouse–Geneva evolution code (TGEC), a stellar evolution code in which the radiative accelerations and opacities are computed in a consistent way, taking into account the variations of the local abundances (Hui-Bon-Hoa 2008; Théado et al. 2012). We chose, as a first step, to focus on models representing the star ν Eri, which is a bright early-B star at the end of its main sequence (MS) life, with an age between 15.7 and 18.9 Myr (Pamyatnykh et al. 2004, Table 1). Precise asteroseismology of this star has been performed using ground-based observations (Pamyatnykh et al. 2004) as well as space missions (BRITE; Daszyńska-Daszkiewicz et al. 2017, hereafter DPW17). This last study placed constraints on the opacity profile needed to reproduce the observations.
Section 2 presents the TGEC and describes the computations in some detail. The results are presented in Sect. 3, where we compare the opacity increase induced by atomic diffusion with the opacity profiles suggested by DPW17 to account for the asteroseismic observations of the star ν Eri. We then discuss the consequences of our results as well as future work in Sect. 4.
2 Computations
The present computations were made with an improved (unpublished) version of the TGEC in which the computing time is reduced through parallelisation and optimised diffusion time steps. Efforts have also been made to ensure a better respect of mass conservation. In addition, the code has been rewritten to easily introduce new chemical elements, such as nickel, whose contribution to the opacity in the Z-bump is up to 25% (Salmon et al. 2012). Mn and Cr have been ignored since their contributions are lower than 15% (Salmon et al. 2012).
At each evolution time step, the structure was computed assuming hydrostatic equilibrium, with opacities from the Opacity Project (OP) OPCD v.3.3 data (Seaton 2005). The OP codes were partly parallelised to increase their performance. All the elements included in the OP data were considered with their current abundance when they were involved in the diffusion routines. Because diffusion induces drastic changes of local abundance in the superficial layers, their initial values have little influence on the final results and were taken as in Grevesse & Noels (1993) for practical reasons. The nuclear rates came from the NACRE compilation (Angulo 1999), and convective mixing was treated with the mixing-length theory with a parameter of 1.8. Fingering mixing, triggered by the inversion of the mean molecular weight gradient (μ-gradient), was implemented using the effective mixing coefficient given by Brown et al. (2013).
Atomic diffusion involves 13 elements and their main isotopes: H, 3He, 4He, 6Li, 7Li, 9Be, 10B, 12C, 13C, 14N, 15N, 16O, 17O, 18O, 20Ne, 22Ne, 24Mg, 25Mg, 26Mg, 40Ca, 56Fe, and 58Ni, and was implemented with the formalism of Chapman & Cowling (1970). In this approach, all the elements but H should have a negligible abundance compared to the hydrogen background (test atom approximation). For helium, we used the method of Montmerle & Michaud (1976). The diffusion coefficients were computed according to Paquette et al. (1986).
Radiative accelerations were calculated with the single-valued parameter (SVP) method (Alecian & LeBlanc 2002; LeBlanc & Alecian 2004). This approach allows fast computations along with a good accuracy compared to interpolations in radiative acceleration tables (OP; Seaton 2005) or computations from detailed monochromatic opacities (Montpellier-Montréal code, Turcotte et al. 1998).
The currently available SVP dataset only covers the mass interval between 1 and 5 M⊙ , and nickel is absent. Taking into account the smooth variation observed for the iron SVP parameters with the stellar mass, we fit them with a power-law function to allow an extrapolation up to the domain of early-B stars. For the same stellar structure and two abundances, we checked that the agreement is good enough between our iron radiative acceleration profiles and those coming from the OP server (Fig. 1).
For Ni, as no data exists, we first assumed that the behaviour of a given ion with respect to its concentration is the same as for the Fe ion with the same number of electrons, thus setting the ψ* and ξ* parameters in Eq. (1) of LeBlanc & Alecian (2004). The φ* parameters of their formula were defined through a least-squares fit to a radiative acceleration profile computed with the Montpellier-Montréal code (O. Richard, priv. comm.). The results are shown in Fig. 1 for a 9.5 M⊙ model at the beginning of the MS.
The models were evolved from pre-main sequence (pre-MS) up to the hydrogen core exhaustion. Atomic diffusion was switched on at the beginning of the MS. As we focused on iron and nickel, these elements were the only ones allowed to diffuse. We added helium to the list because of its important contribution to the mean molecular weight.
The boundary condition issue is difficult to tackle. The most simple case is to assume that no element flux exists at the stellar surface, which may not be quite realistic. As the elements are individually subject to radiative accelerations up to the most outer layers, they probably leave the star in a selective way. A correct treatment of this effect would need consistent computations of atomic diffusion between the internal structure and the atmosphere. Such models are not available at present, but the computations of model atmospheres using the PHOENIX code (Hauschildt et al. 1997, and references therein) including radiative accelerations (Hui-Bon-Hoa et al. 2002)help deriving some assumptions about the selective outflow. The loss of each element is then modelised by a sink term applied to the outermost layers of TGEC. A global mass loss flux may also be simulated by removing the layers corresponding to the mass lost between two evolution time steps. The stellar internal structure readjusts itself accordingly.
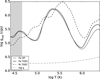 |
Fig. 1 TGEC radiative accelerations for Fe (thick solid line) and Ni (thick dashed line) at the beginning of the MS, with solar abundances. Local gravity is denoted by the dash-dotted line. The thin solid line shows the OP Fe radiative accelerations for comparison. The grey area represents the superficial convective zone. |
Fundamental parameters of ν Eri according to Pamyatnykh et al. (2004).
3 Results
With the aim of comparing our results with the DPW17 opacity profiles for the star ν Eri, we computed the evolution of models with masses of 9.5 M⊙. We started from our grid of pre-MS models with homogeneous abundances, and a metal content of 0.018. For all the models, the given ages include the pre-MS phase, which lasted 0.22 Myr.
3.1 Models without mass-loss
We first computed a model with dynamical convection only, no fingering mixing, no outward flux of the elements, and no mass loss. The stellar evolution had to be stopped at 0.95 Myr – long before the age of ν Eri – because the numerical fraction of Fe in the superficial convection zone became too large for the test atom approximation to remain valid. Using the Burgers (1969) formalism would help to proceed, but in any case, this would lead to an unrealistic fraction of Fe in the upper layers. Figure 2 presents the normalised abundance profiles for He, Fe, and Ni in the upper panel, and the opacity in the lower panel.
Performing an asteroseismic analysis is beyond the scope of the present paper, therefore we compared our opacity profiles withthose of DPW17. To do this, we applied their method to the opacity profiles of our homogeneous models, which were modified with Gaussian functions fitted in location, width, and height, with the values of their OP model.
A peak-shaped accumulation occurs when the element flux reaches a local minimum, which reflects the behaviour of the radiative accelerations. The link is obvious for iron around log T = 5.05 when comparing Figs. 1 and 2. We remark that the equilibrium abundance method (in which the abundance profile is set by equating radiative accelerations and gravity) would yield abundance and radiative acceleration maxima at the same location, which is not the case with time-dependent calculations. The wavy profile of the Ni radiative acceleration, which may arise from the assumptionswe made to compute the SVP parameters, should be considered cautiously, along with the small local accumulations it generates. Nevertheless, we can be confident about the location of the bottom of the overabundance zone at log T = 5.5 since the maximum of the radiative accelerations is rather well defined.
Considering radiative diffusion alone leads to a small increase in opacity in the Z-bump (Fig. 2, bottom panel). This is due to the limited contribution of Ni (25%, Salmon et al. 2012)and to the shift in location between the Fe overabundance peak and its maximum opacity. At log T = 5.3, Fe almost has its initial mass fraction, whereas its contribution to the opacity is estimated to be 65% by Salmon et al. (2012). Moreover, the total opacity maximum is below the amount required according to asteroseismology.
The accumulations of Fe and Ni lead to inverse μ-gradients, which trigger fingering mixing. We therefore computed a model including this mixing process, still without mass loss and any element outward flux. Here again, the evolution stopped before reaching the end of the MS because the iron abundance in the outer layers was too strong, but this occurred at 5.35 Myr, that is, later than in the previous model.
Fingering mixing flattens the metal abundance profiles, leading to an almost step-like shape (Fig. 3). This dilution delays the time when the overabundances of Fe reach the test atom approximation limit. The layers with overabundances now encompass the whole Z-bump, yielding a high increase in opacity, higher than that of DPW17, but with a single peak instead of two. The opacity maximum is slightly shifted towards higher temperatures compared to the initial profile because Ni has a greater overabundance than Fe, the former element having its maximum contribution at log T = 5.46 instead of log T = 5.3 for the latter in the OP data (Salmon et al. 2012). The metal abundances are large enough in the Z-bump for a convective zone to appear.
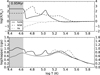 |
Fig. 2 Upper panel: normalised mass fraction profiles for He (dash-dots),Fe (solid), and Ni (dashes) vs. temperature. The grey area denotes the superficial convective zone, and the age, counted from the pre-MS, is shown in the upper left. The dotted line recalls the initial content. Lower panel: Rosseland mean opacity profile at the current age for the diffusion model (thick solid line) and the homogeneous model (thin solid line). The thin dashed line shows the profile of the homogeneous model with local enhancement according tothe method of DPW17. |
3.2 Models with mass-loss
The zero-flux boundary condition leads to superficial accumulations of Fe that prevent the computation of the whole MS evolution. In addition, Nieva & Przybilla (2012) showed that iron presents an almost solar abundance at the surface of this type of stars. We thus investigated which type of boundarycondition might allow reaching the age of ν Eri with theobserved abundance of Fe.
An element can flow away if its radiative accelerations are strongerthan gravity in the outermost layers of the star. To determine how Fe and Ni would behave at the surface, we computed their radiative accelerations in a chemically homogeneous model atmosphere with the same fundamental parameters as our model of ν Eri at the beginning of the MS. Figure 4 shows the behaviour of the radiative accelerations in the atmosphere and the inner structure. For Fe, the radiative accelerations of TGEC agree with those of PHOENIX within 0.1 dex. The shapes are very similar, which is remarkable because the data and the computation methods differ. The situation is much less satisfactory for Ni because data for the first four ions are lacking in TGEC.
The radiative accelerations for both elements are much stronger than gravity everywhere in the atmosphere for the initial abundance. Since the surface radiative accelerations of TGEC are stronger than gravity throughout the evolution, Fe and Ni are very likely to flow away.
In a model with an outflow that is only driven by radiative accelerations, a strong iron overabundance still appears at the surface and reaches the test atom approximation limit after about 10 Myr. The amount of iron lost at the surface is too small to balance the iron brought from below.
To evolve the model until the age of ν Eri and try to match the results of Nieva & Przybilla (2012), we then added a global outflow of all the elements. Winds have been detected in early B-type stars (e.g. Prinja 1989), with a typical value of 10−12 M⊙/yr for stars of the same type as ν Eri.
We evolved several models with rates from 10−13 M⊙/yr up to 10−11 M⊙/yr. The abundance and opacity profiles are shown in Fig. 5 for the 10−12 M⊙/yr model. The loss of Fe is dominated by the global outflow. The abundance profiles still have a step-like shape because of the fingering mixing, and increasing the mass-loss rate will reduce the surface overabundance of iron and shift the step in the abundance profile towards the surface. The increase in opacity in the Z-bump is also reduced.
With a rate of 5 × 10⁻¹² M⊙/yr, the surface iron abundance is still twice as high as the initial abundance, whereas the opacity in the Z-bump remains close to the opacity of the homogeneous model.
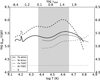 |
Fig. 4 Radiative accelerations of Fe (solid lines) and Ni (dashed lines) computed in the atmosphere (“atmo.”, thick line) and in the inner structure (“TGEC”, thin line) at the beginning of the MS vs. temperature (lower scale) or optical depth (upper scale). The grey area shows the location of the convective zone, and the dotted line the local gravity. |
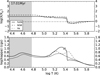 |
Fig. 5 Same as Fig. 2 for a model with fingering mixing, global massloss with a rate of 10−11 M⊙/yr, and element outflow due to radiative accelerations. |
4 Discussion and conclusions
Our results showed that radiative diffusion could create an opacity enhancement in the Z-bump, provided fingering mixing is at play to extend the overabundances over the whole Z-bump. Regardless of the assumptions used in the computations, our opacity profile shows only one broad peak, whereas the profile obtained by Daszyńska-Daszkiewicz et al. (2017) is less regular, with two maxima. We focused on their OP model as we used the same data, but they needed a multiple Gaussian shape to adjust the opacity for any dataset they used. A flat iron abundance profile such as ours would always yielda broad peak since its contribution to the opacity shows a full-width at half-maximum of about 0.5 in log T (see Fig. 2 of Salmon et al. 2012). Secondary peaks would only appear if elements such as Ni, Cr, or Mn had strong enough abundances, which would have to be much higher than that of iron owing to their lower contribution to the opacity. The two last elements are not part of this study, but as far as Ni is concerned, our models show that its mass fraction in the Z-bump at the age of ν Eri is only one tenth of that of iron. It therefore seems difficult to reconcile our opacity profile in terms of shape with those adjusted to excite given observed modes, at least for this star.
However, the use of OP data could be misleading for these three elements since their atomic data come from an extrapolation of those of Fe (Badnell et al. 2005), and Turck-Chièze et al. (2016) pointed out that the OP opacities of Cr and Ni differ from other sources such as OPLIB (Colgan et al. (2015), Colgan et al. 2016), in which the computations has been performed in detail. The use of this type of data is thus required to draw more definite conclusions about the shape of the opacity peak in models with atomic diffusion. Moreover, we recall that any change in the opacities will modify the radiative accelerations, and the models should consider both these effects consistently.
Our models cannot yield a solar abundance for Fe at the surface and an opacity increase in the Z-bump simultaneously since the overabundances needed for the Z-bump opacity are brought to the surface by fingering mixing. The diffusion of other elements could change the μ-profile, and therefore the way fingering mixing acts on the iron profile. If the connection were weaker between the inner and the outermost layers, it might help reconcile the calculations with the observed surface abundance. Nevertheless, studying the diffusion of other elements would be at least as challenging as iron concerning the surface abundances since Nieva & Przybilla (2012) derived quasi-solar values for most of the elements they studied, in a sample including many pulsating stars.
Other uncertainties come from the surface abundance evolution with time. Coupled time-dependent computations of atomic diffusion in both the atmosphere and the inner structure are urgently needed to understand the fate of the chemicals at the stellar surface.
We aim to improve these computations in various ways. Consistent tests of the influence of modifying the opacities are required, taking into account the correlated modifications of the radiative accelerations on Fe and Ni. The importance of the chosen initial abundances needs to be studied. Finally, instead of comparing our results with other computations, a real stability analysis of the seismic modes in our models is required. This may be our project in the near future.
References
- Alecian, G., & LeBlanc, F. 2002, MNRAS, 332, 891 [NASA ADS] [CrossRef] [Google Scholar]
- Angulo, C. 1999, AIP Conf. Proc., 495, 365 [Google Scholar]
- Badnell, N. R., Bautista, M. A., Butler, K., et al. 2005, MNRAS, 360, 458 [NASA ADS] [CrossRef] [Google Scholar]
- Bailey, J. E., Nagayama, T., Loisel, G. P., et al. 2015, Nature, 517, 56 [NASA ADS] [CrossRef] [Google Scholar]
- Bourge, P.-O., & Alecian, G. 2006, in Astrophysics of Variable Stars, eds. C. Aerts, & C. Sterken, ASP Conf. Ser., 349, 201 [NASA ADS] [Google Scholar]
- Brown, J. M., Garaud, P., & Stellmach, S. 2013, ApJ, 768, 34 [NASA ADS] [CrossRef] [Google Scholar]
- Burgers, J. M. 1969, Flow Equations for Composite Gases (New York: Academic Press) [Google Scholar]
- Chapman, S., & Cowling, T. G. 1970, The Mathematical Theory of Non-uniform Gases: an Account of the Kinetic Theory of Viscosity, Thermal Conduction and Diffusion in Gases (Cambridge University Press) [Google Scholar]
- Colgan, J., Kilcrease, D. P., Magee, N. H., et al. 2015, High Energy Density Phys., 14, 33 [NASA ADS] [CrossRef] [Google Scholar]
- Colgan, J., Kilcrease, D. P., Magee, N. H., et al. 2016, ApJ, 817, 116 [NASA ADS] [CrossRef] [Google Scholar]
- Daszyńska-Daszkiewicz, J., Pamyatnykh, A. A., Walczak, P., et al. 2017, MNRAS, 466, 2284 [NASA ADS] [CrossRef] [Google Scholar]
- Grevesse, N., & Noels, A. 1993, in Origin and Evolution of the Elements, eds. N. Prantzos, E. Vangioni-Flam, & M. Casse, 15 [Google Scholar]
- Hauschildt, P. H., Baron, E., & Allard, F. 1997, ApJ, 483, 390 [NASA ADS] [CrossRef] [Google Scholar]
- Hui-Bon-Hoa, A. 2008, Ap&SS, 316, 55 [NASA ADS] [CrossRef] [Google Scholar]
- Hui-Bon-Hoa, A., LeBlanc, F., Hauschildt, P. H., & Baron, E. 2002, A&A, 381, 197 [NASA ADS] [CrossRef] [EDP Sciences] [Google Scholar]
- LeBlanc, F., & Alecian, G. 2004, MNRAS, 352, 1329 [NASA ADS] [CrossRef] [Google Scholar]
- Montmerle, T., & Michaud, G. 1976, ApJS, 31, 489 [NASA ADS] [CrossRef] [Google Scholar]
- Nieva, M.-F., & Przybilla, N. 2012, A&A, 539, A143 [NASA ADS] [CrossRef] [EDP Sciences] [Google Scholar]
- Pamyatnykh, A. A., Handler, G., & Dziembowski, W. A. 2004, MNRAS, 350, 1022 [NASA ADS] [CrossRef] [Google Scholar]
- Paquette, C., Pelletier, C., Fontaine, G., & Michaud, G. 1986, ApJS, 61, 177 [NASA ADS] [CrossRef] [Google Scholar]
- Prinja, R. K. 1989, MNRAS, 241, 721 [NASA ADS] [CrossRef] [Google Scholar]
- Salmon, S., Montalbán, J., Morel, T., et al. 2012, MNRAS, 422, 3460 [NASA ADS] [CrossRef] [MathSciNet] [Google Scholar]
- Seaton, M. J. 2005, MNRAS, 362, L1 [NASA ADS] [CrossRef] [Google Scholar]
- Théado, S., Alecian, G., LeBlanc, F., & Vauclair, S. 2012, A&A, 546, A100 [NASA ADS] [CrossRef] [EDP Sciences] [Google Scholar]
- Turck-Chièze, S., Le Pennec, M., Ducret, J. E., et al. 2016, ApJ, 823, 78 [NASA ADS] [CrossRef] [Google Scholar]
- Turcotte, S., Richer, J., Michaud, G., Iglesias, C. A., & Rogers, F. J. 1998, ApJ, 504, 539 [NASA ADS] [CrossRef] [Google Scholar]
All Tables
All Figures
|
Fig. 1 TGEC radiative accelerations for Fe (thick solid line) and Ni (thick dashed line) at the beginning of the MS, with solar abundances. Local gravity is denoted by the dash-dotted line. The thin solid line shows the OP Fe radiative accelerations for comparison. The grey area represents the superficial convective zone. |
| In the text | |
|
Fig. 2 Upper panel: normalised mass fraction profiles for He (dash-dots),Fe (solid), and Ni (dashes) vs. temperature. The grey area denotes the superficial convective zone, and the age, counted from the pre-MS, is shown in the upper left. The dotted line recalls the initial content. Lower panel: Rosseland mean opacity profile at the current age for the diffusion model (thick solid line) and the homogeneous model (thin solid line). The thin dashed line shows the profile of the homogeneous model with local enhancement according tothe method of DPW17. |
| In the text | |
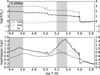 |
Fig. 3 Same as Fig. 2 for a model with fingering mixing. |
| In the text | |
|
Fig. 4 Radiative accelerations of Fe (solid lines) and Ni (dashed lines) computed in the atmosphere (“atmo.”, thick line) and in the inner structure (“TGEC”, thin line) at the beginning of the MS vs. temperature (lower scale) or optical depth (upper scale). The grey area shows the location of the convective zone, and the dotted line the local gravity. |
| In the text | |
|
Fig. 5 Same as Fig. 2 for a model with fingering mixing, global massloss with a rate of 10−11 M⊙/yr, and element outflow due to radiative accelerations. |
| In the text | |
Current usage metrics show cumulative count of Article Views (full-text article views including HTML views, PDF and ePub downloads, according to the available data) and Abstracts Views on Vision4Press platform.
Data correspond to usage on the plateform after 2015. The current usage metrics is available 48-96 hours after online publication and is updated daily on week days.
Initial download of the metrics may take a while.