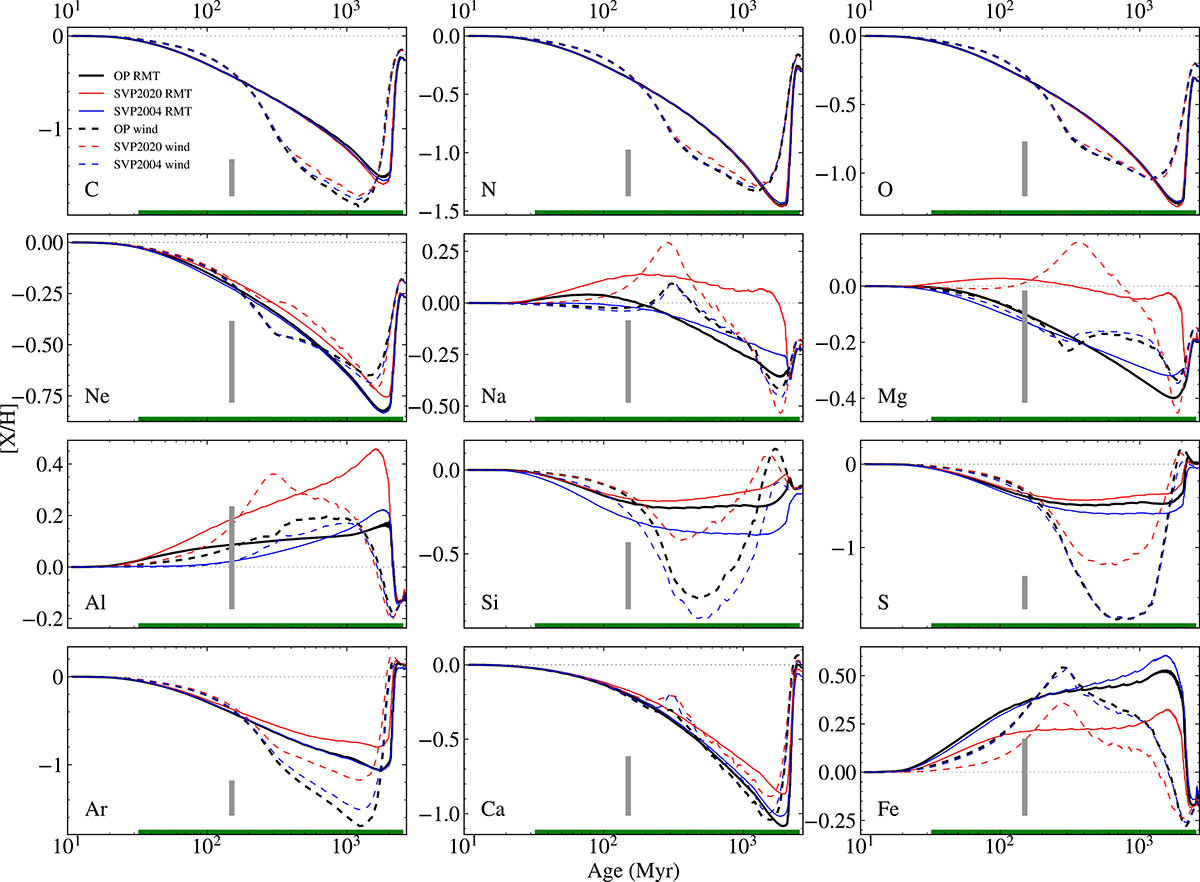
Fig. 5.
Download original image
Time evolution of the surface abundances for the 1.5 M⊙ model with grad computed with OP (thick black line), SVP2020 (red line), and SVP2004 (blue line), expressed as the difference between the logarithm of the current ratio to H in number fractions and the corresponding initial value. Solid lines represent the models with RMT mixing, and dashed lines the mass loss (‘wind’) models. The thin dotted line represents the initial abundance. In each panel, the grey bar shows the typical abundance uncertainties (see the main text). The horizontal green bar represents the MS phase.
Current usage metrics show cumulative count of Article Views (full-text article views including HTML views, PDF and ePub downloads, according to the available data) and Abstracts Views on Vision4Press platform.
Data correspond to usage on the plateform after 2015. The current usage metrics is available 48-96 hours after online publication and is updated daily on week days.
Initial download of the metrics may take a while.