Fig. 2.
Download original image
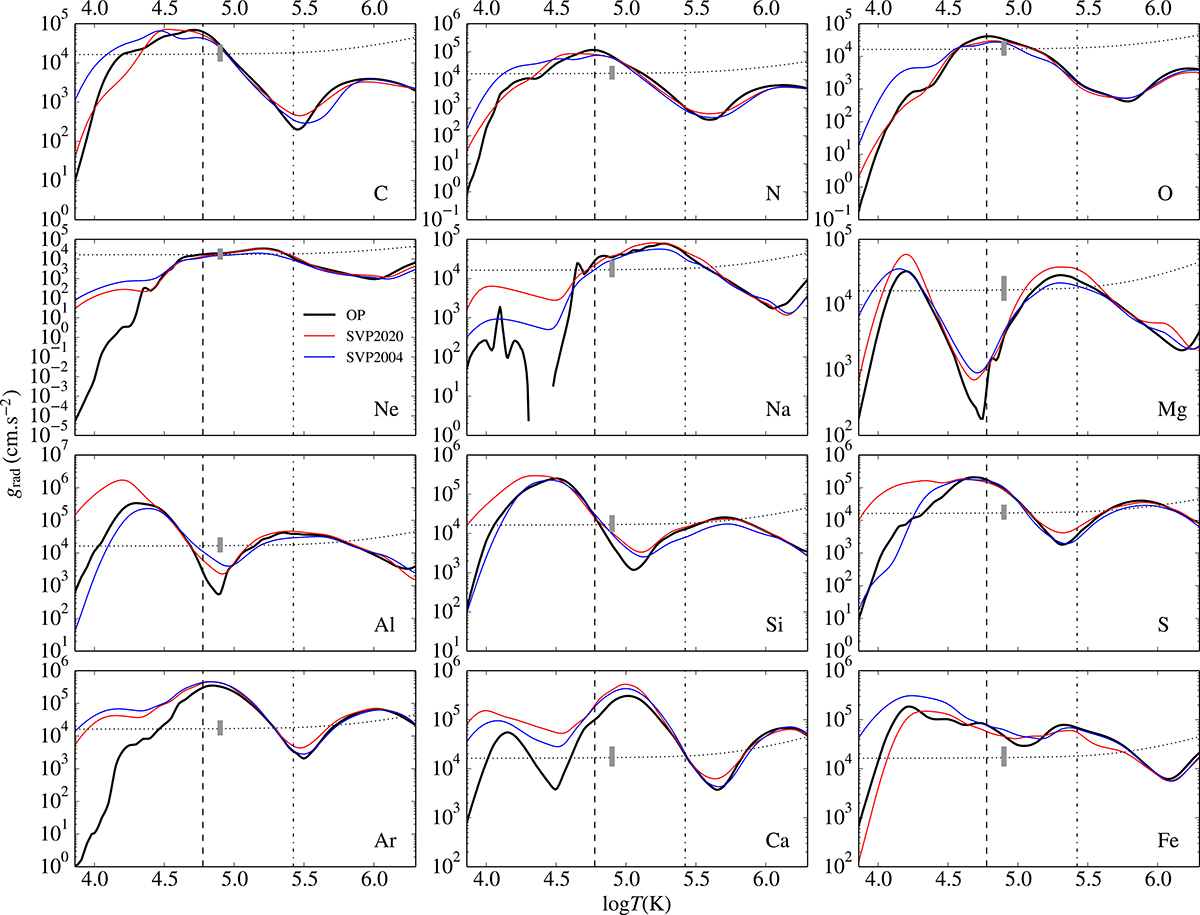
Radiative accelerations vs. log T at mid-MS computed with OP data (thick black lines) and the SVP2020 and SVP2004 methods (red and blue lines, respectively) for a chemically homogeneous 1.5 M⊙ model. The dotted lines denote the local gravity (in absolute values). The vertical lines show the location of the bottom of the H and He convective zones (dashed and dash-dotted lines, respectively). The grey bar near the centre of each panel illustrates the maximum acceptable difference in the grad (see the main text). The gap in the OP curve for Na corresponds to negative values (not shown).
Current usage metrics show cumulative count of Article Views (full-text article views including HTML views, PDF and ePub downloads, according to the available data) and Abstracts Views on Vision4Press platform.
Data correspond to usage on the plateform after 2015. The current usage metrics is available 48-96 hours after online publication and is updated daily on week days.
Initial download of the metrics may take a while.