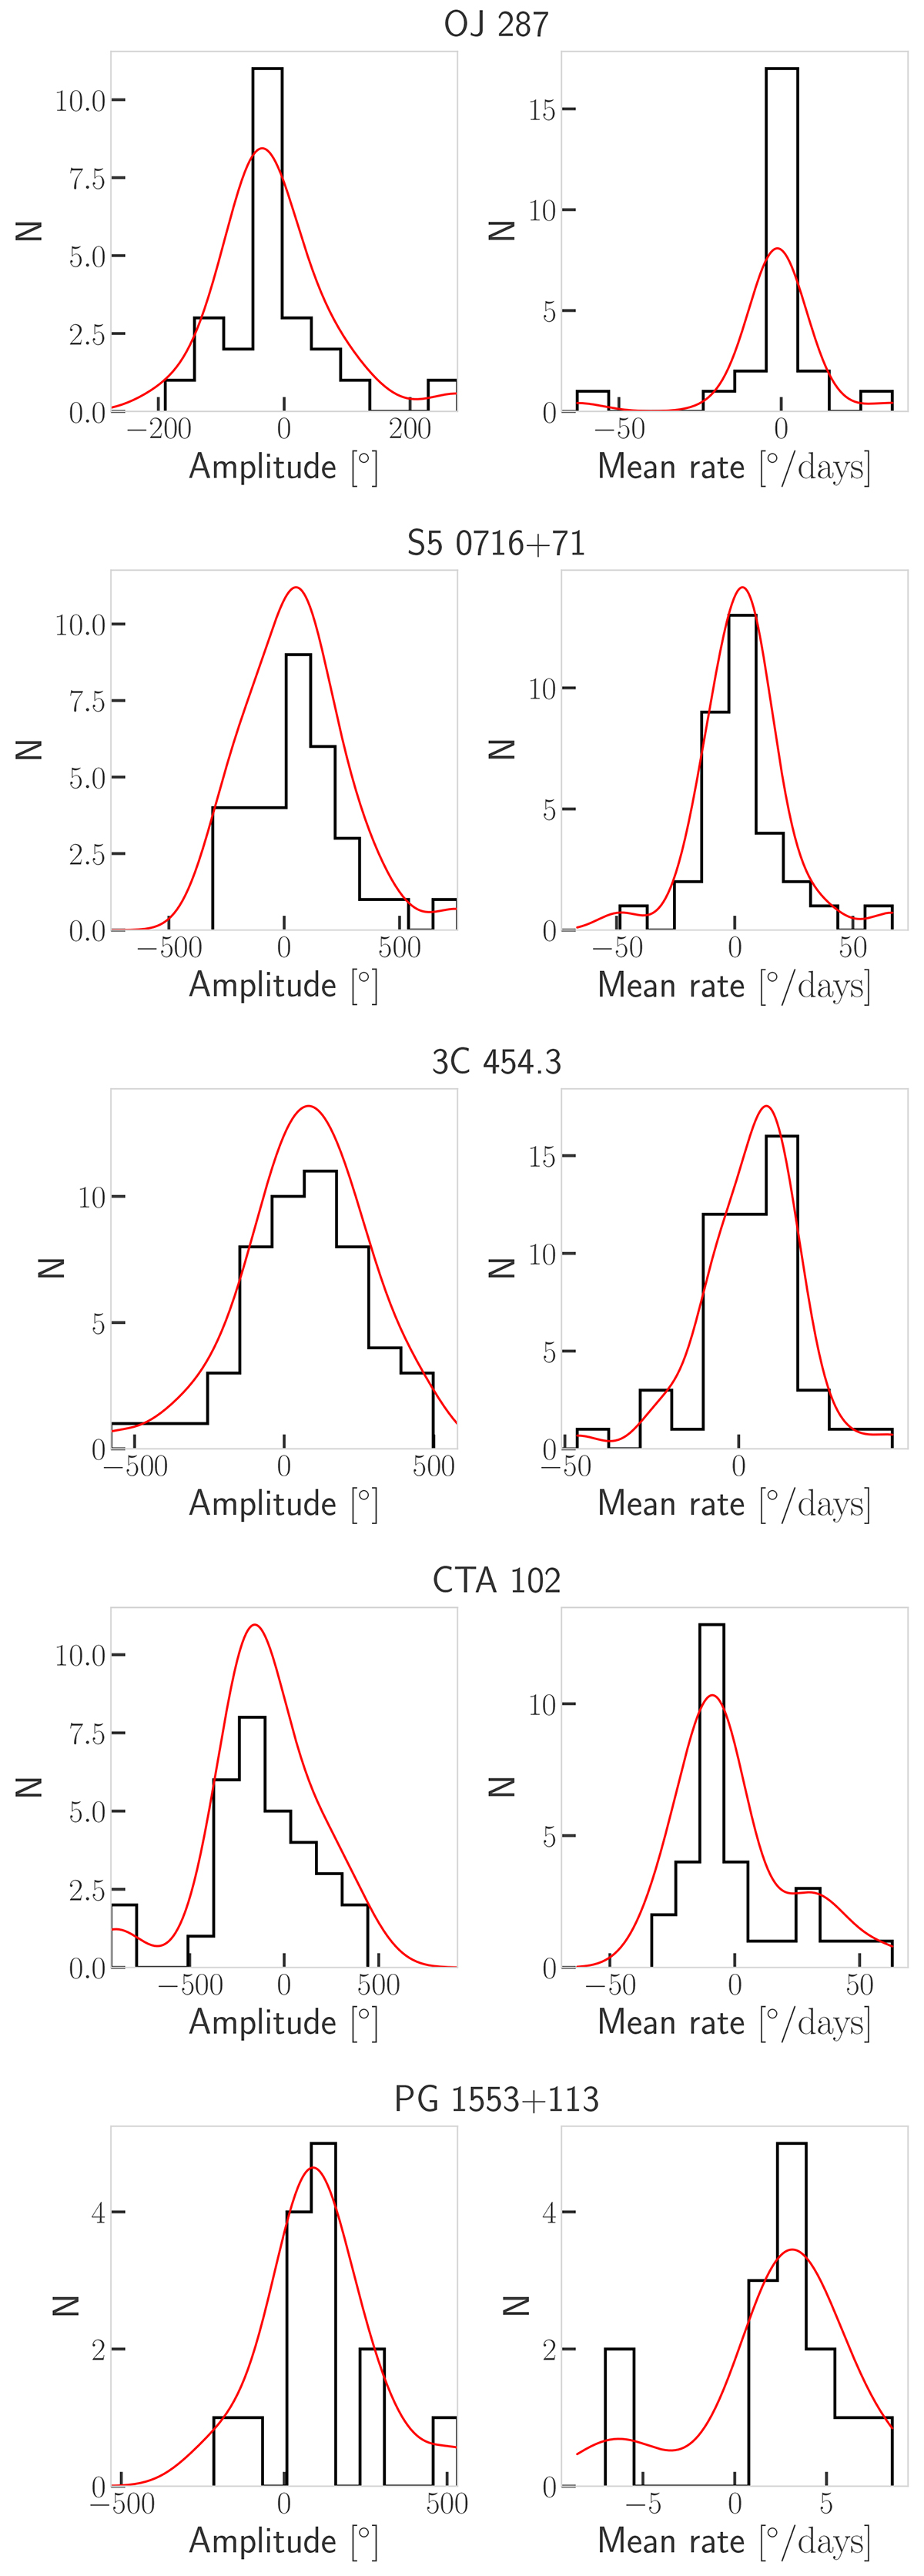
Fig. 1.
Download original image
Distribution of the amplitudes (left) and rates (right) of EVPA rotations for each blazar of our sample. The black line shows the histograms, and the red line shows the histograms smoothed with Gaussian kernels. Positive values of the amplitudes and rates correspond to CCW rotations, and negative values correspond to CW rotations.
Current usage metrics show cumulative count of Article Views (full-text article views including HTML views, PDF and ePub downloads, according to the available data) and Abstracts Views on Vision4Press platform.
Data correspond to usage on the plateform after 2015. The current usage metrics is available 48-96 hours after online publication and is updated daily on week days.
Initial download of the metrics may take a while.