Fig. 2.
Download original image
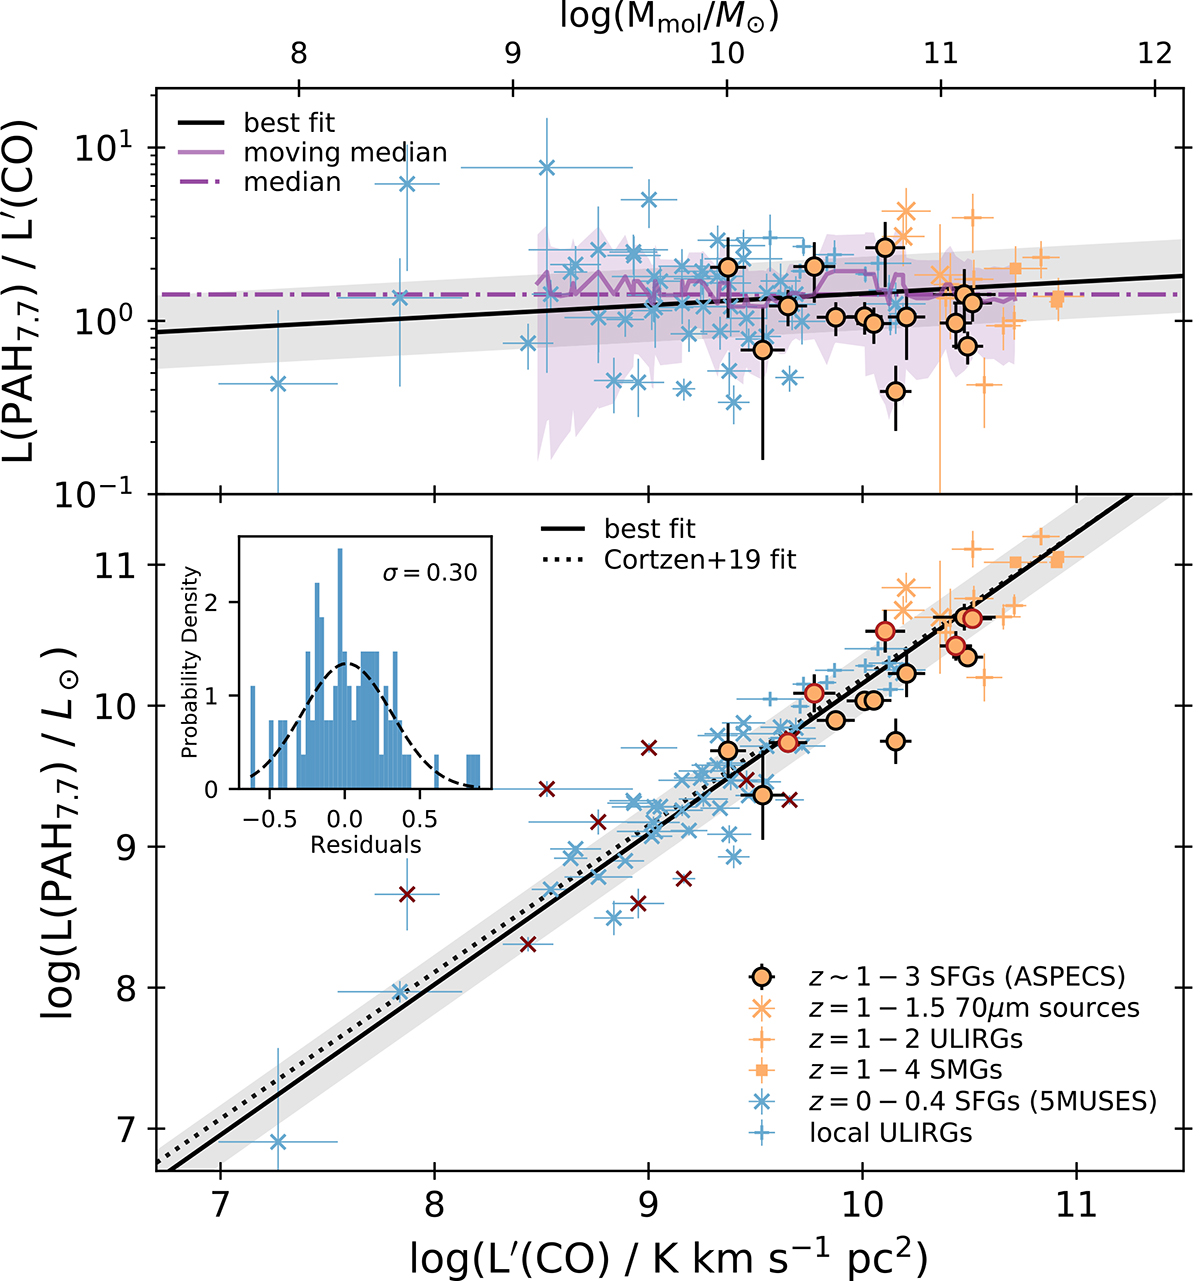
PAH and CO luminosity from z ∼ 0 to 4. Data at redshifts below and above 1 are shown in blue and orange, respectively. The ASPECS sample from this work is shown with orange circles. Other samples are from the Cortzen et al. (2019) compilation: high-z non-ULIRG sources (Pope et al. 2013), high-z ULIRGs (Yan et al. 2010), local star-forming galaxies (SFGs; Kirkpatrick et al. 2014; Cortzen et al. 2019), and local ULIRGs (Armus et al. 2007; Desai et al. 2007). Our sample clearly bridges the gap between the low- and high-z relations and extends the high-z sample to PAH and CO luminosities that are lower by about an order of magnitude, into the regime of local (U)LIRGs. We marked the AGN-dominated galaxies at all redshifts in red. For reference, molecular gas mass estimates from CO luminosities (assuming αCO = 4.3 M⊙(K km s−1 pc2)−1; Bolatto et al. 2013) are shown on the top horizontal axis. In both panels, the best-fit linear model to log(L(PAH))−log(L′(CO)) using the HYPERFIT method (Robotham & Obreschkow 2015) is shown with a solid black line. The grey shaded region indicates the intrinsic vertical scatter from the fit. The inset panel shows the histogram of the fit residuals, which are centred at 0 with a small scatter (σ). The C19 best-fit line is shown with a dotted line in the bottom panel. The top panel also shows the median of the L(PAH) to L′(CO) ratio (dashed-dotted line) and its moving (running) median and scatter (solid purple line and shaded region). All the statistical parameters are listed in Table 1. As shown by the moving median and the fit, the PAH-to-CO luminosity ratio is fully consistent with a constant value for a diverse population of galaxies – from star-forming galaxies to ULIRGs, SMGs, and starbursts – at z = 0 to ∼4.
Current usage metrics show cumulative count of Article Views (full-text article views including HTML views, PDF and ePub downloads, according to the available data) and Abstracts Views on Vision4Press platform.
Data correspond to usage on the plateform after 2015. The current usage metrics is available 48-96 hours after online publication and is updated daily on week days.
Initial download of the metrics may take a while.