Fig. 9.
Download original image
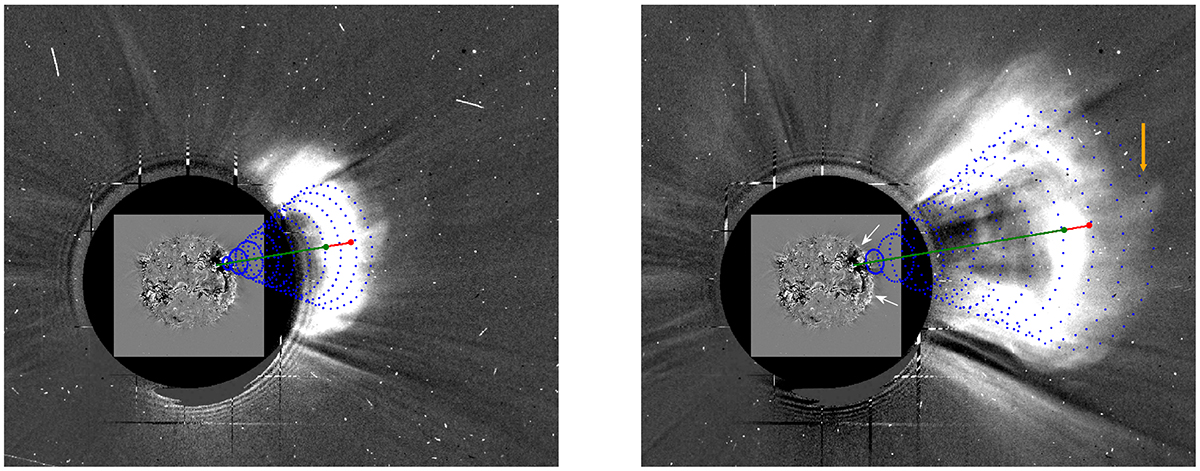
Extrapolation of the DIRECD cone (blue mesh) to STEREO-A COR2 images at 12:23 UT (left panel) and 13:23 UT (right panel). The green line represents the main axis of the cone and shows the direction of CME propagation. The green marker indicates the extrapolated height of the filament, and the red marker at the top of the red line indicates the same for the CME front outer edge. The cone approximately matches the shape of the CME, with fainter CME parts corresponding to far-side cone projections (orange arrow).
Current usage metrics show cumulative count of Article Views (full-text article views including HTML views, PDF and ePub downloads, according to the available data) and Abstracts Views on Vision4Press platform.
Data correspond to usage on the plateform after 2015. The current usage metrics is available 48-96 hours after online publication and is updated daily on week days.
Initial download of the metrics may take a while.