Fig. 8.
Download original image
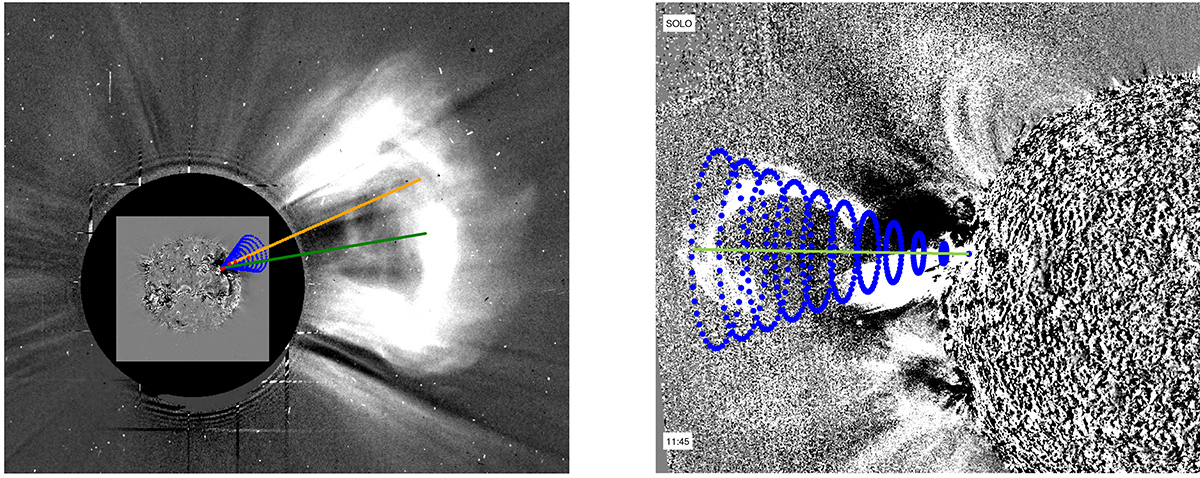
Filament deflection and 3D cone projections. Left panel: LOS projections of the DIRECD cone (blue mesh) to the STEREO-A view to both 195 Å EUVI (11:50 UT) and COR2 (13:23 UT) images. Red dots show the LOS projections of the filament’s 3D coordinates, and the orange line represents LOS projections of a linear fit to the filament points used as the cone’s central axis (CME pre-deflection direction). The green line indicates the CME post-deflection direction determined from the 3D reconstructions of the filament’s height at 11:45 UT (see Fig. 4). Right panel: LOS projections (blue mesh) of the DIRECD cone to the 304 Å Solar Orbiter view at 11:45 UT, after the filament deflection. The green line shows the CME post-deflection direction. The cone closely matches the filament shape.
Current usage metrics show cumulative count of Article Views (full-text article views including HTML views, PDF and ePub downloads, according to the available data) and Abstracts Views on Vision4Press platform.
Data correspond to usage on the plateform after 2015. The current usage metrics is available 48-96 hours after online publication and is updated daily on week days.
Initial download of the metrics may take a while.