Fig. 7.
Download original image
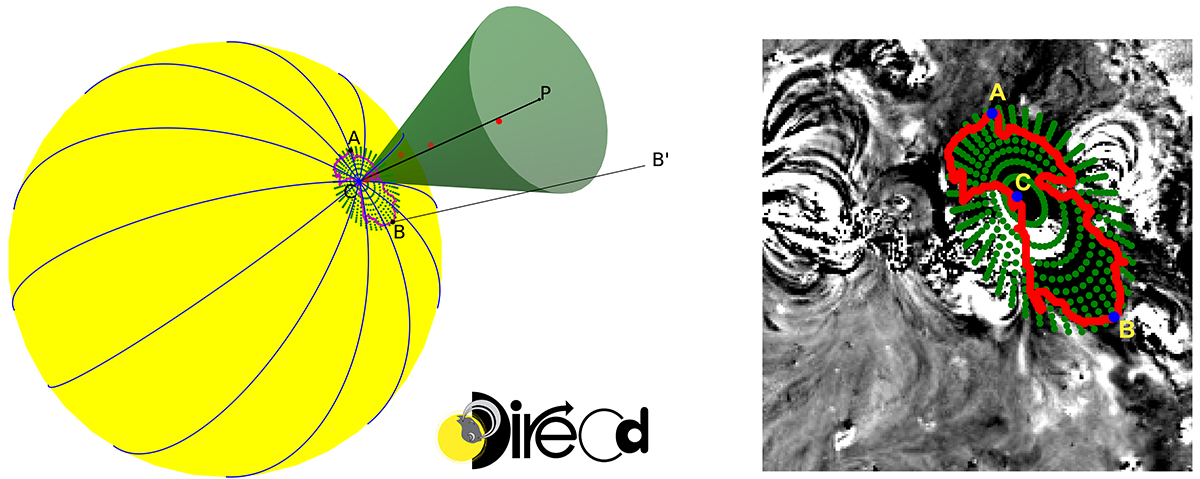
Application of the DIRECD method to relate the expansion of coronal dimming to the early CME propagation. Left panel: CME cone model from the DIRECD method. Magenta boundaries outline the dimming. Point C is the filament source, and points A and B mark the largest extent of the north and south dimming. Red markers show the 3D coordinates of the filament, and the black line represents a linear fit to the filament points. The green cone, with a filament fit used as the cone’s central axis, has a height of 1.12 Rsun and a half-width (half-aperture angle) of 21°. Green dots indicate the orthogonal projections of the CME cone onto the solar surface. We require an edge of the cone base to be orthogonally projected to point B to match the extent of the dimming. Right panel: STEREO-A 195 Å base-difference image, together with the boundary of the identified dimming region (red) at the end of the impulsive phase (11:50:00 UT), and the orthogonal projections (green) of the best-fit cone obtained with DIRECD.
Current usage metrics show cumulative count of Article Views (full-text article views including HTML views, PDF and ePub downloads, according to the available data) and Abstracts Views on Vision4Press platform.
Data correspond to usage on the plateform after 2015. The current usage metrics is available 48-96 hours after online publication and is updated daily on week days.
Initial download of the metrics may take a while.