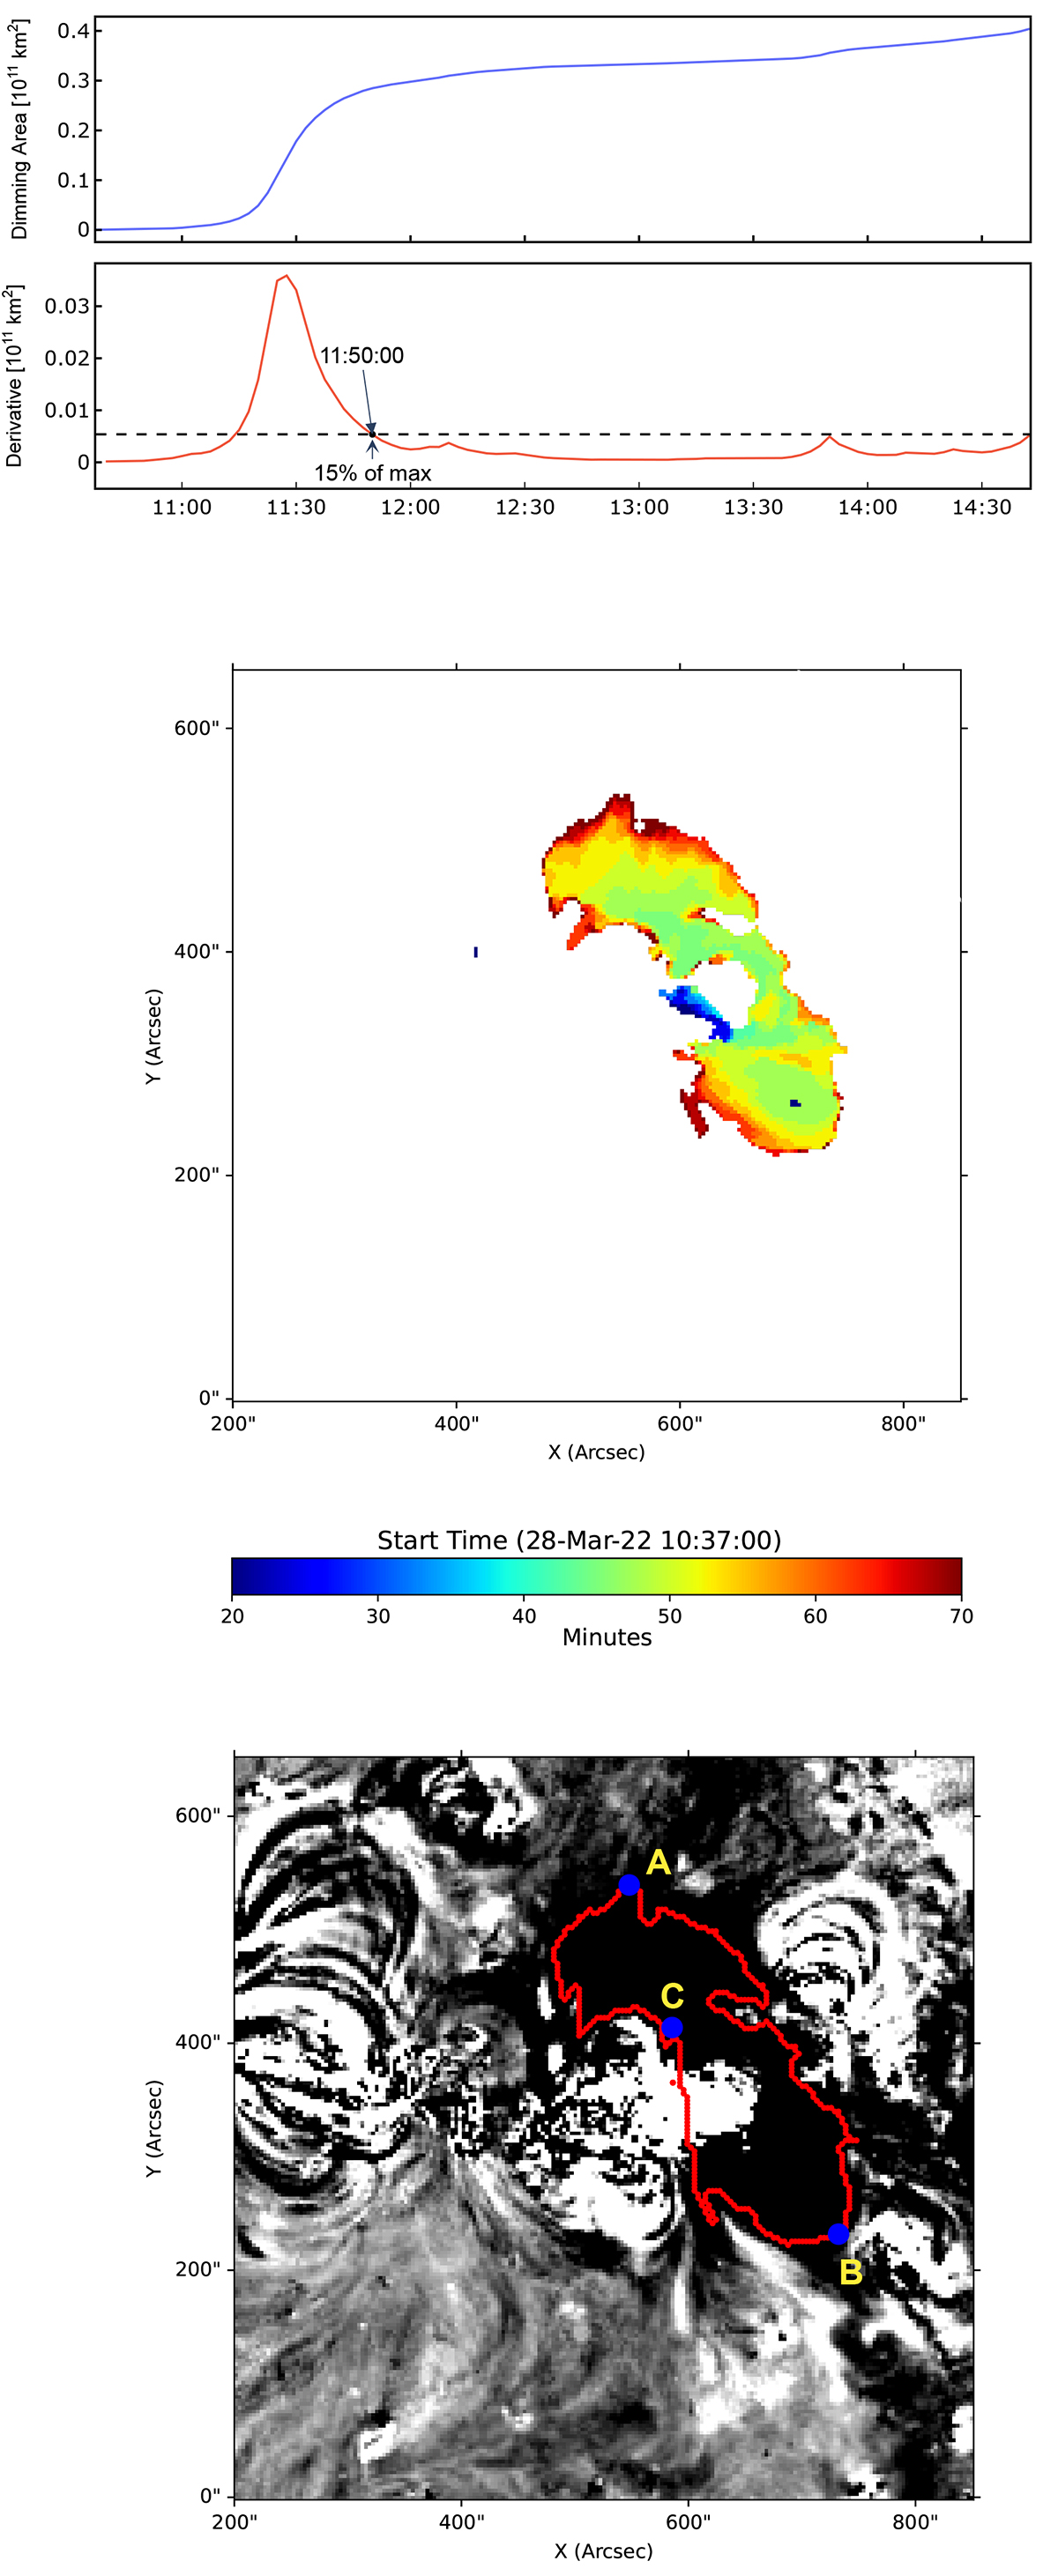
Fig. 6.
Download original image
Dimming detection. First row: Expansion of the dimming area, A(t) (top panel) and its time derivative, dA/dt (bottom panel) over 4 hours. Second row: Cumulative timing map of the dimming extraction, colour-coded in minutes from 10:37 UT using STEREO-A 195 Å logarithmic base ratio images. Third row: STEREO-A 195 Å base-difference image together with the boundary of the identified dimming region (red) at the end of the impulsive phase (11:50:00 UT). Point C is the filament source, and points A and B mark the largest extent of the north and south dimming.
Current usage metrics show cumulative count of Article Views (full-text article views including HTML views, PDF and ePub downloads, according to the available data) and Abstracts Views on Vision4Press platform.
Data correspond to usage on the plateform after 2015. The current usage metrics is available 48-96 hours after online publication and is updated daily on week days.
Initial download of the metrics may take a while.