Fig. 4.
Download original image
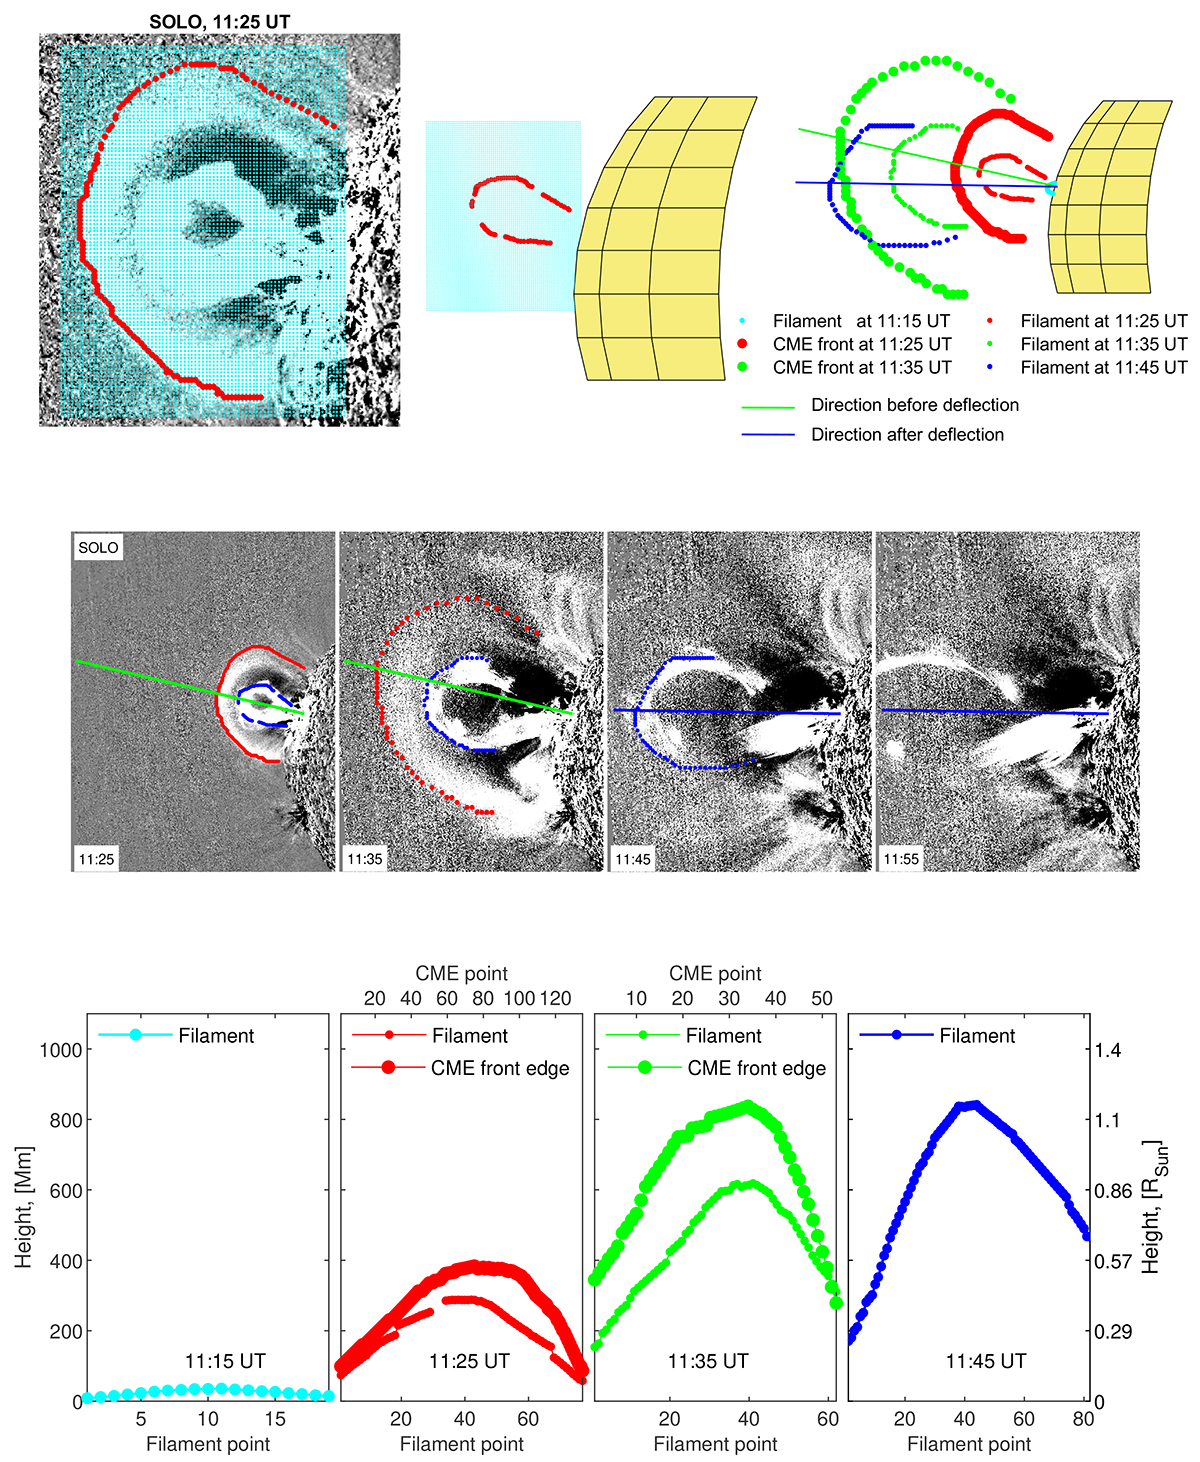
Full 3D reconstructions of the outer CME front and filament structures. Top row: ATLAS-3D reconstructions of the outer CME front and the filament. Left panel: LOS projections of a 3D plane (cyan mesh) constructed through the 3D filament points (red markers) in the 304 Å Solar Orbiter/EUI base-difference image. Middle panel: 3D plane (cyan mesh) and 3D filament coordinates (red markers). Right panel: 3D coordinates of all considered filament and CME front structures determined from both 3D reconstructions based on epipolar geometry and the ATLAS-3D method. At 11:45 UT, a filament deflection at 11.9° is observed. The green line indicates the filament pre-deflection direction, determined as the linear fit through its highest points, while the blue line represents its post-deflection direction. Middle row: Evolution of the filament as seen in Solar Orbiter/EUI 304 Å base-difference images over 30 minutes, from 11:25 to 11:55 UT. Blue dots outline the filament, red dots the CME front. The green line depicts the primary direction of the filament propagation, with a deflection (indicated by the blue line) observed at 11:45 UT. Bottom row: Heights of the filament loops and outer CME front edges from 11:15 to 11:45 UT. The bottom x-axis represents a filament point, while the top x-axis (for 11:25 and 11:35 UT) shows a point of the CME’s front edge.
Current usage metrics show cumulative count of Article Views (full-text article views including HTML views, PDF and ePub downloads, according to the available data) and Abstracts Views on Vision4Press platform.
Data correspond to usage on the plateform after 2015. The current usage metrics is available 48-96 hours after online publication and is updated daily on week days.
Initial download of the metrics may take a while.