Fig. 3.
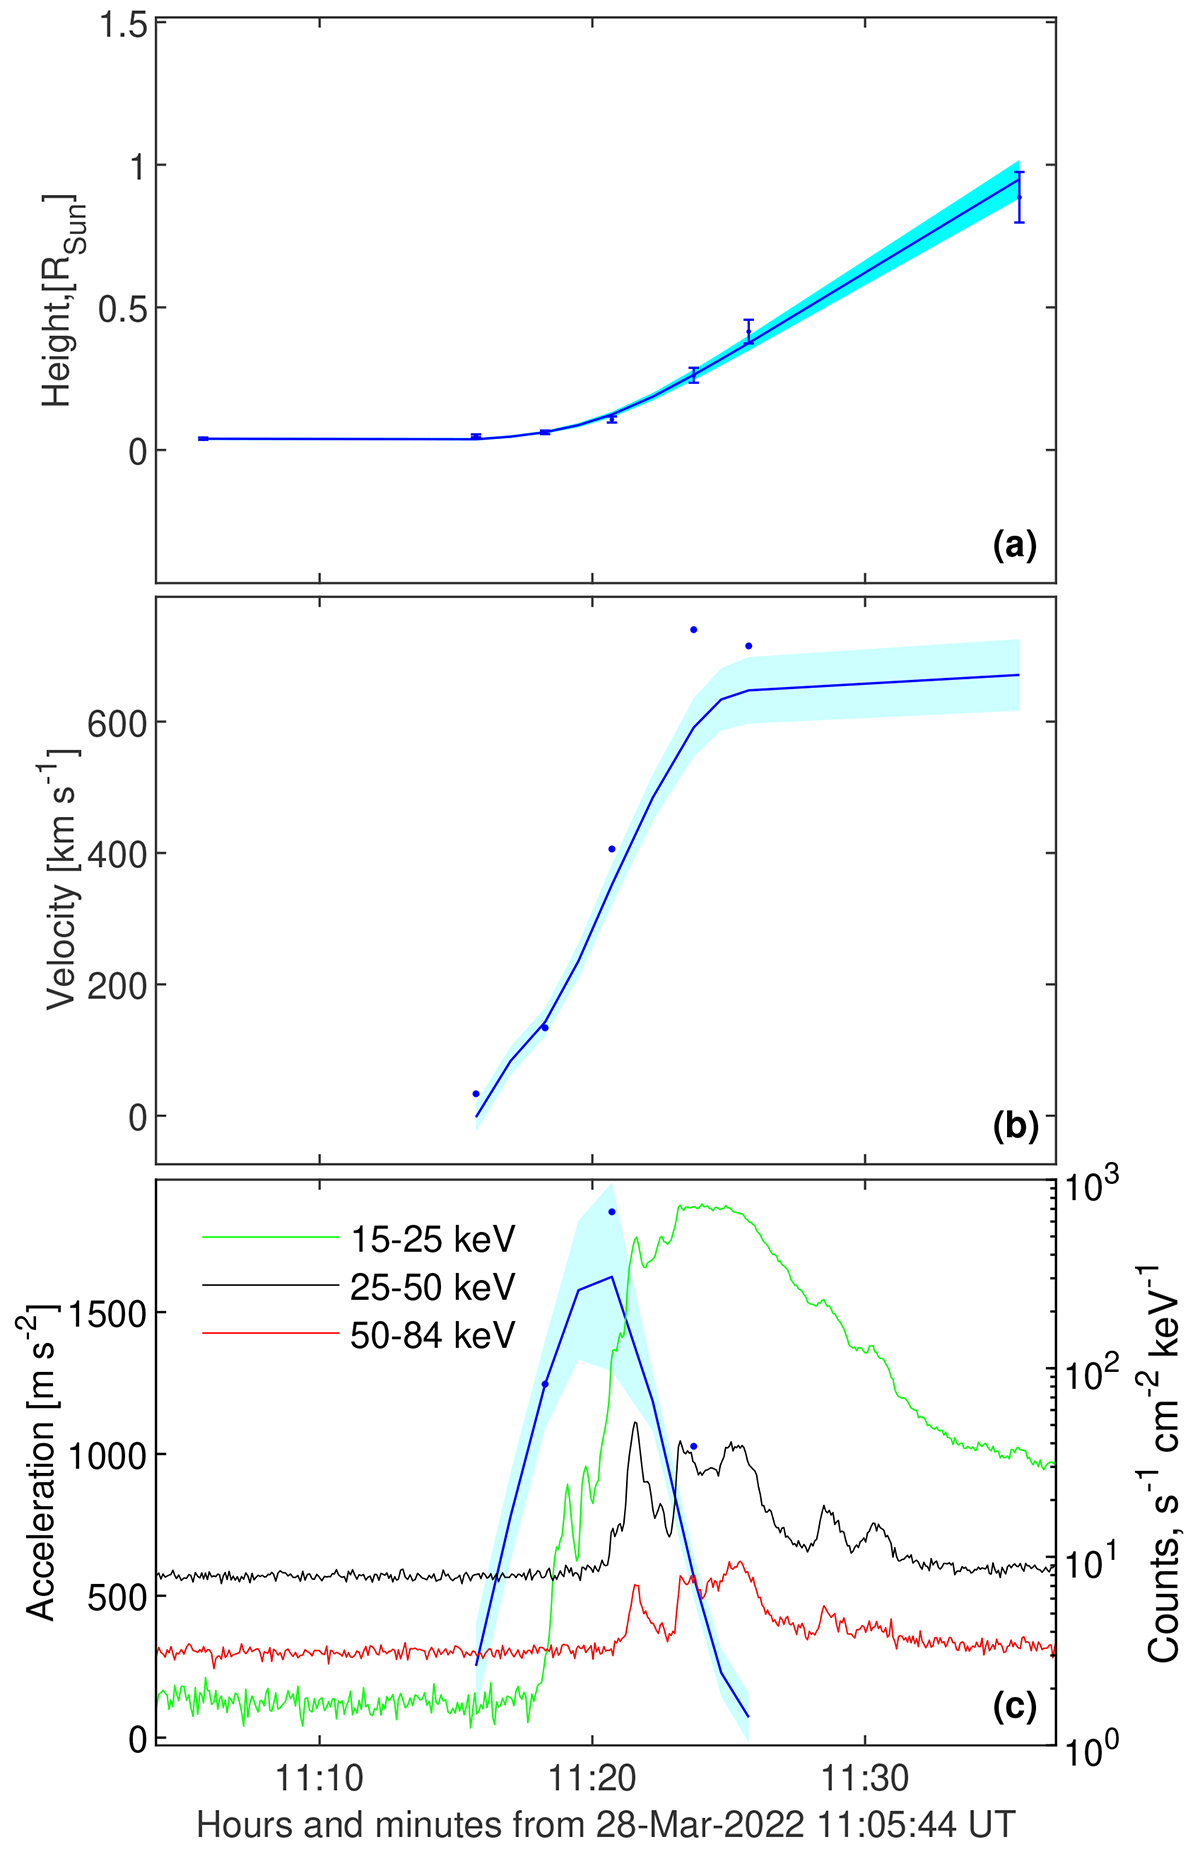
Download original image
Kinematics of the erupting filament and the Solar Orbiter/STIX HXR flux of the associated flare in three energy bands from 15 to 84 keV. (a) Filament height-time plot (blue circles) obtained from Solar Orbiter, STEREO-A, and SDO 304 Å images together with error bars (10% from the height values). The solid line shows the smoothed height–time profile. (b) Velocity and (c) acceleration of the filament obtained via numerical differentiation of the measured height-time data (dots) and the smoothed profiles (lines). The shaded areas outline the error ranges. Solar Orbiter/STIX data are shifted by the difference in travel time (+319 s) with respect to Earth.
Current usage metrics show cumulative count of Article Views (full-text article views including HTML views, PDF and ePub downloads, according to the available data) and Abstracts Views on Vision4Press platform.
Data correspond to usage on the plateform after 2015. The current usage metrics is available 48-96 hours after online publication and is updated daily on week days.
Initial download of the metrics may take a while.