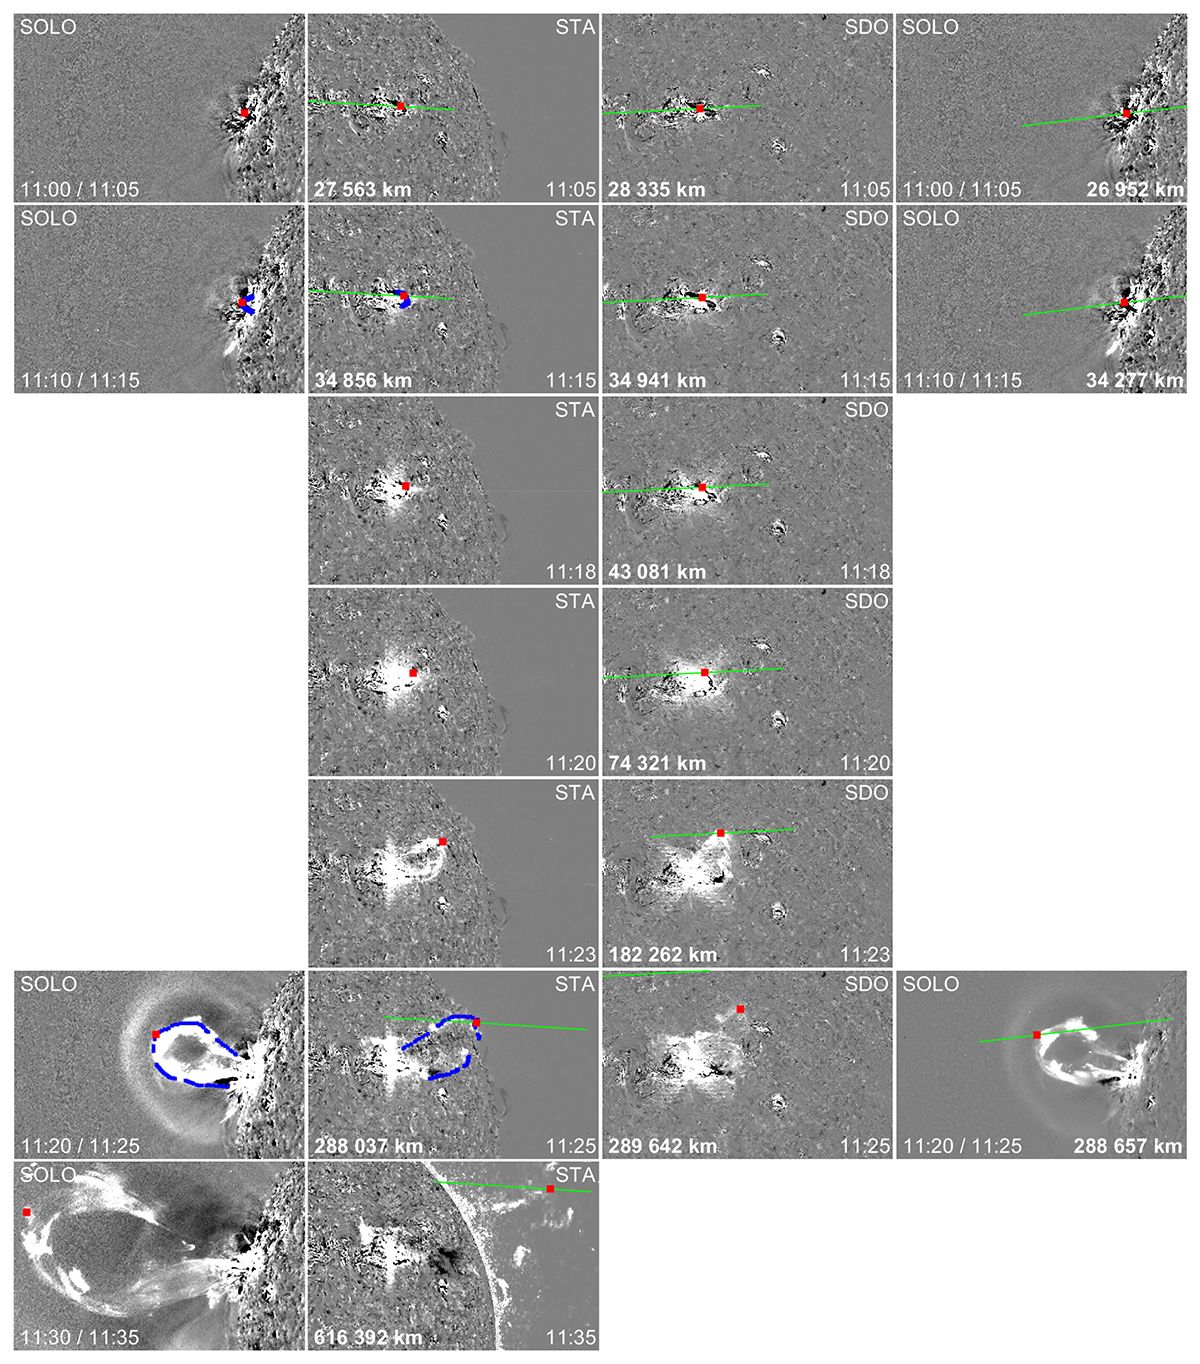
Fig. 2.
Download original image
3D reconstruction of the erupting filament between 11:05 and 11:35 UT in Solar Orbiter/EUI (SOLO), STEREO-A/EUVI (STA), and SDO/AIA 304 Å base-difference images. Column 1 includes both the Solar Orbiter and Earth times to facilitate comparisons with Earth-based observers. The red marker shows the upper tip of the filament, which matches in the three viewpoints. Epipolar lines are shown in green. Blue markers indicate the points along the filament used for the 3D reconstructions of the filament loops at 11:15 and 11:25 UT in SOLO and STEREO-A base-difference images.
Current usage metrics show cumulative count of Article Views (full-text article views including HTML views, PDF and ePub downloads, according to the available data) and Abstracts Views on Vision4Press platform.
Data correspond to usage on the plateform after 2015. The current usage metrics is available 48-96 hours after online publication and is updated daily on week days.
Initial download of the metrics may take a while.