Fig. 4
Download original image
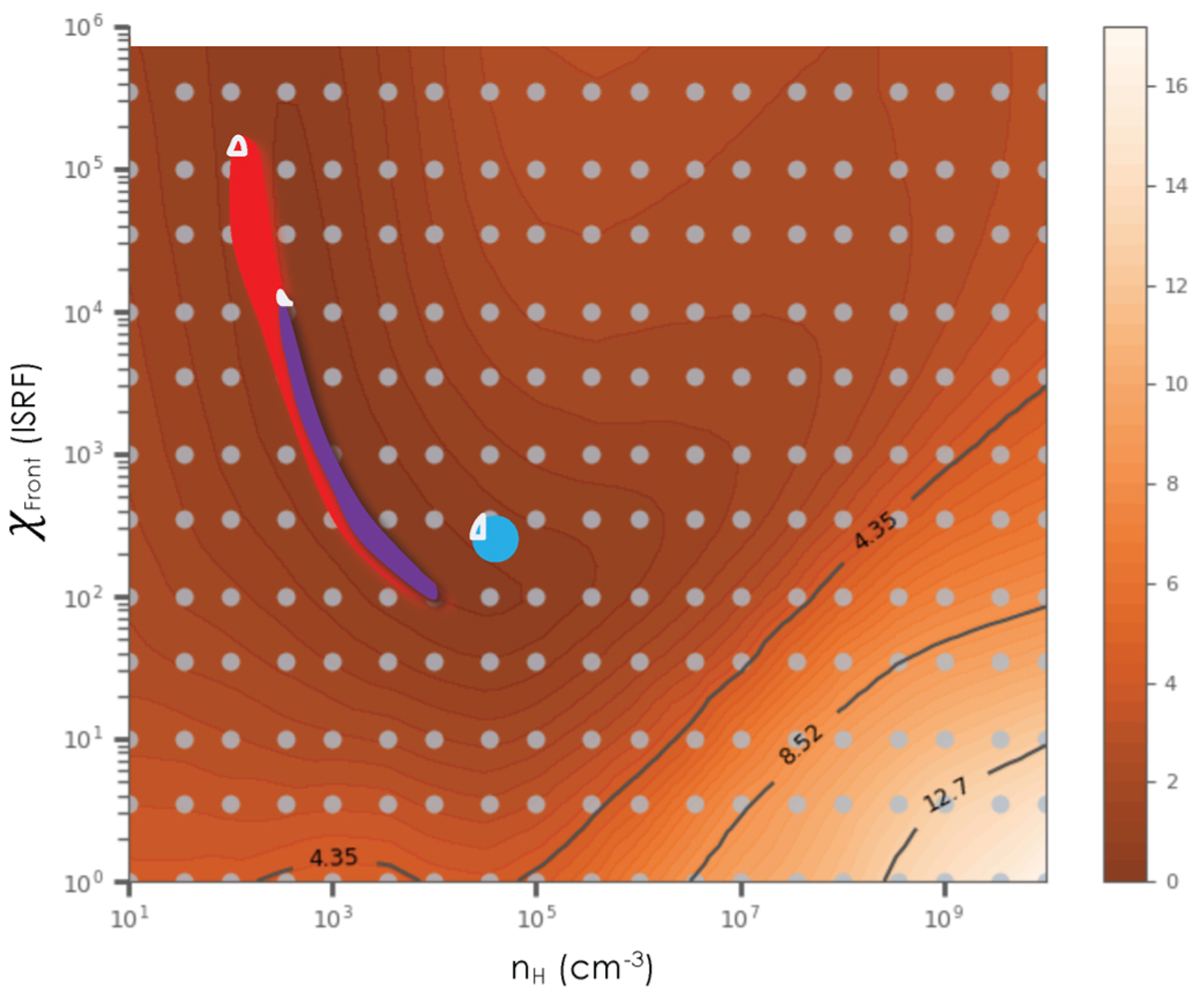
χ2 values for a grid of isochoric ISMDB models compared to the observed fine structure line intensities in the G1 filament. Blue circle and the elongated red area show best fits, respectively, to the [C II]/[O I] 145 µm data at positions M–O and [C II]/[O I] 63 µm data at positions G–L. The elongated magenta area shows the best fit to all data with [O I] 145 µm line intensities scaled down by a factor of 3, as described in the text. All models assume normal incidence. Increasing the incidence angle to 60° provides comparable fit, but shifts the best-fit solution to higher densities and lower χ values (magenta area).
Current usage metrics show cumulative count of Article Views (full-text article views including HTML views, PDF and ePub downloads, according to the available data) and Abstracts Views on Vision4Press platform.
Data correspond to usage on the plateform after 2015. The current usage metrics is available 48-96 hours after online publication and is updated daily on week days.
Initial download of the metrics may take a while.