Fig. 2
Download original image
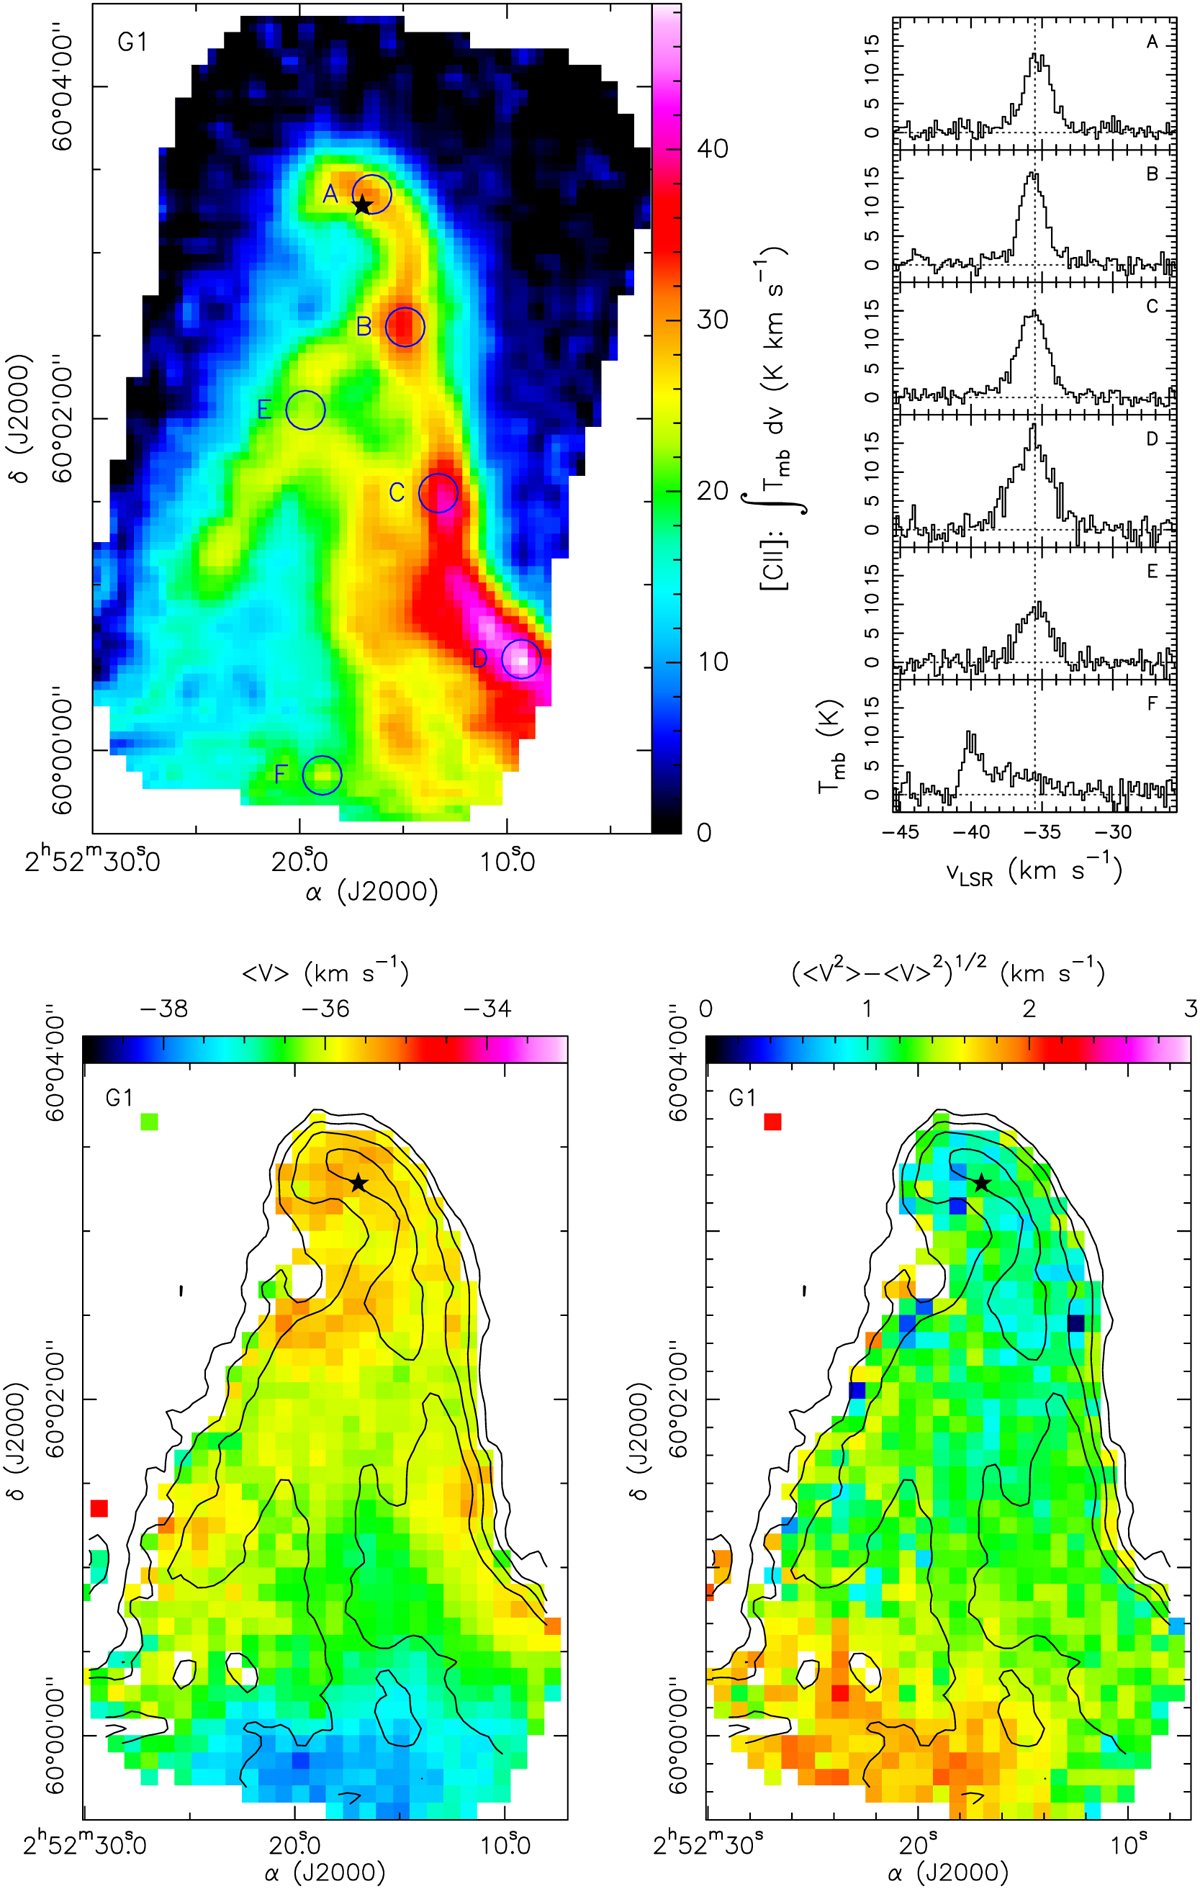
[C II] emission toward the G1 filament. (Top) Color image of the [C II] integrated line intensity in the −40 to − 33.5 km s−1 velocity range. The right panel shows spectra at selected positions labeled A–F in the image. Blue circles correspond to the FWHM SOFIA beam size at the [C II] frequency. (Bottom) Maps of the [C II] line center velocity and velocity dispersion (color images, left and right panels, respectively). Only pixels with [C II] intensities above 3.5σ (11.6 K km s−1) are shown. Black contours show the integrated line intensity, with the same contour levels as in Figure 1. Black star marks the location of the bright IRAC compact source in each panel.
Current usage metrics show cumulative count of Article Views (full-text article views including HTML views, PDF and ePub downloads, according to the available data) and Abstracts Views on Vision4Press platform.
Data correspond to usage on the plateform after 2015. The current usage metrics is available 48-96 hours after online publication and is updated daily on week days.
Initial download of the metrics may take a while.