Open Access
Fig. A.7
Download original image
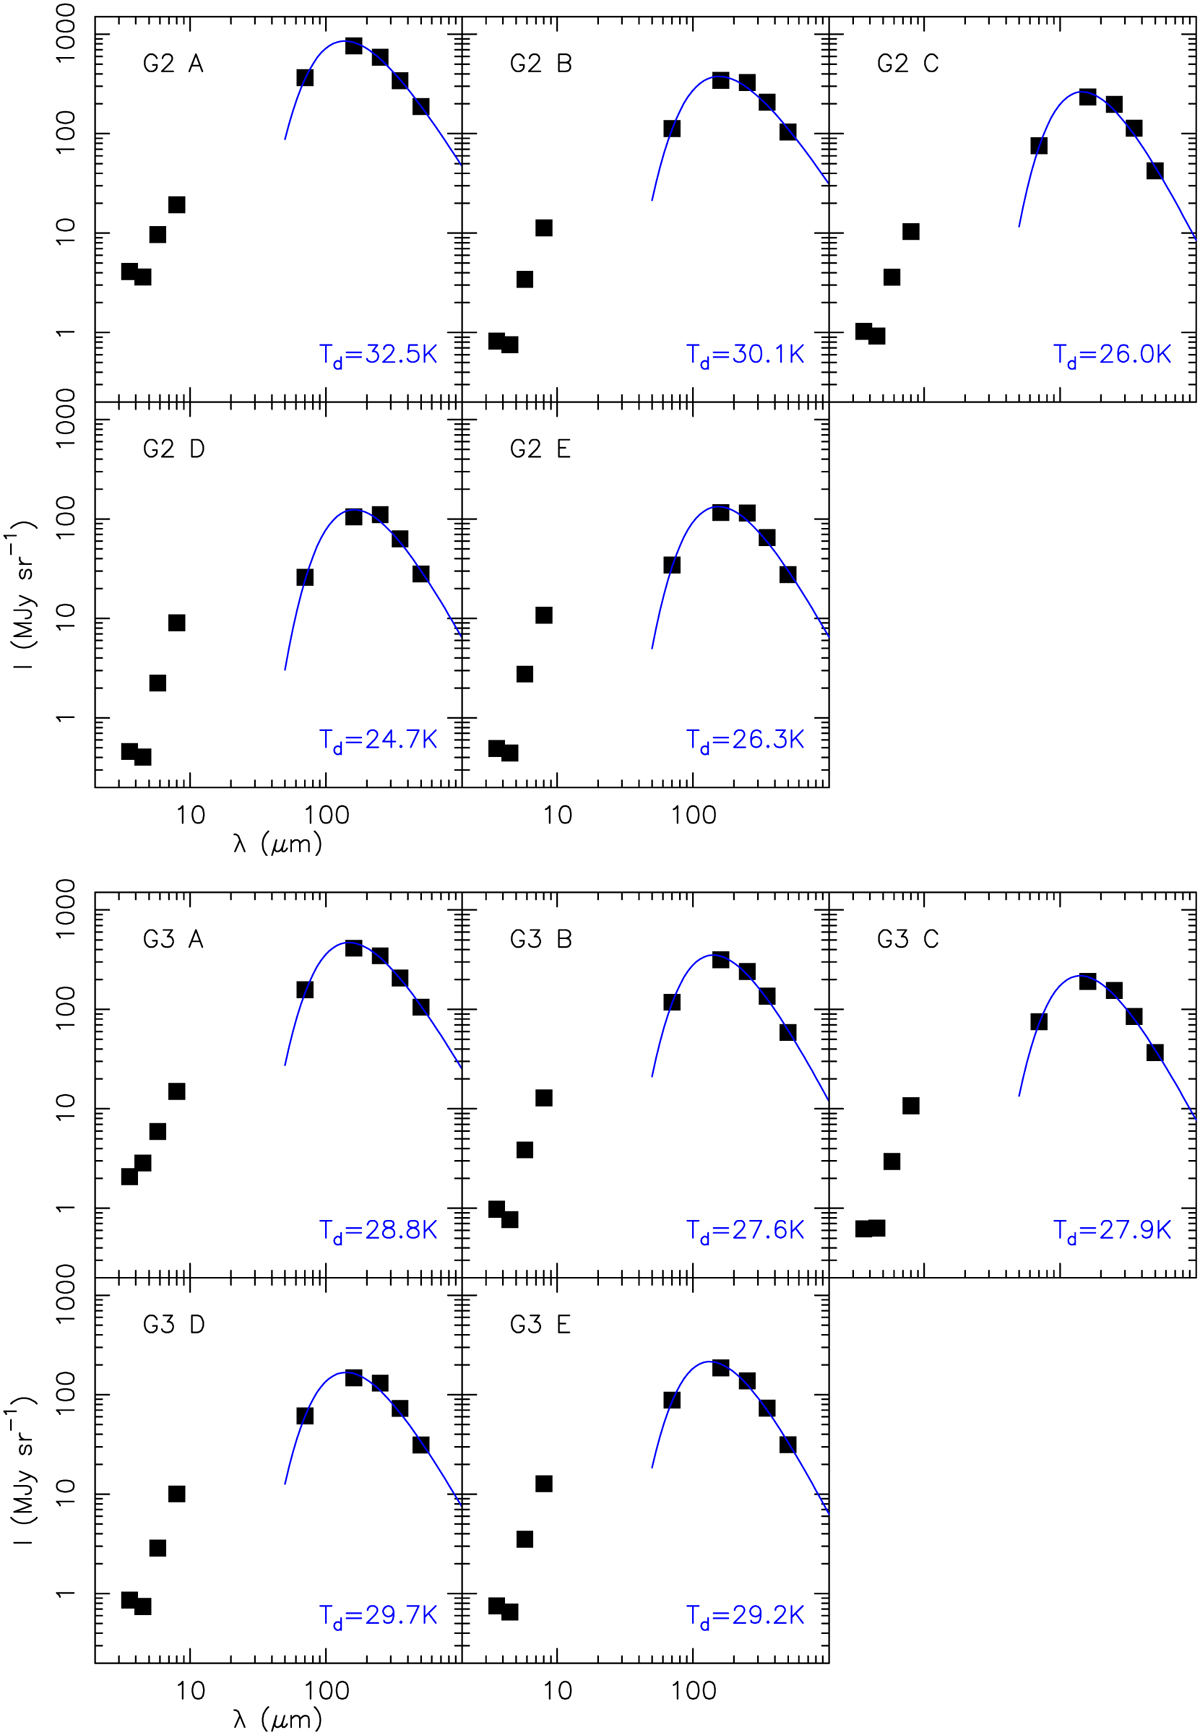
Spectral energy distributions toward positions A–E in the G2 and G3 filaments, top and bottom respectively. Blue curves show the modified blackbody fits to the Herschel PACS and SPIRE fluxes from which the dust temperatures and 350 µm optical depths used for the column density determination are derived.
Current usage metrics show cumulative count of Article Views (full-text article views including HTML views, PDF and ePub downloads, according to the available data) and Abstracts Views on Vision4Press platform.
Data correspond to usage on the plateform after 2015. The current usage metrics is available 48-96 hours after online publication and is updated daily on week days.
Initial download of the metrics may take a while.