Open Access
Fig. A.6
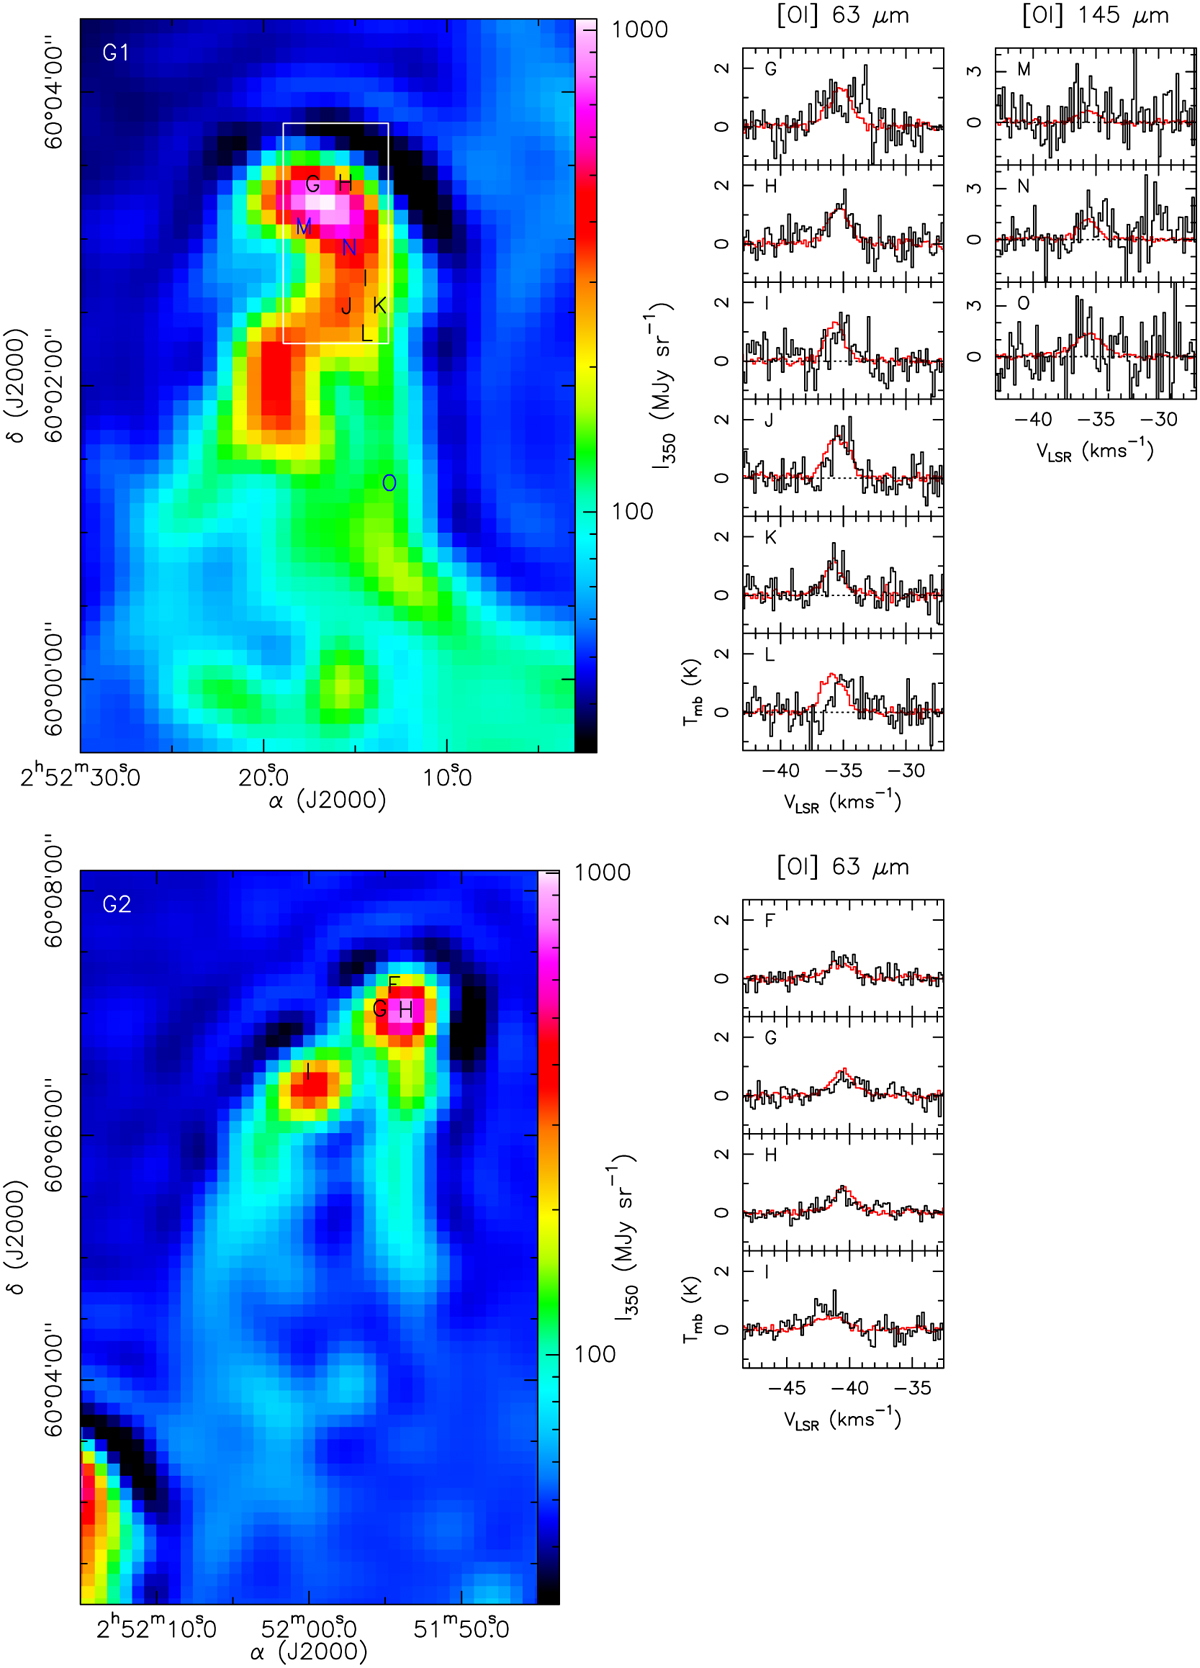
Download original image
[O I] spectra (black histograms) toward positions G–O in the G1 filament (top) and positions F–G in the G2 filament (bottom). Red histograms show the corresponding [C II] spectra divided by 10. Positions at which the spectra are taken are marked on the SPIRE 350 µm images shown in the left panels.
Current usage metrics show cumulative count of Article Views (full-text article views including HTML views, PDF and ePub downloads, according to the available data) and Abstracts Views on Vision4Press platform.
Data correspond to usage on the plateform after 2015. The current usage metrics is available 48-96 hours after online publication and is updated daily on week days.
Initial download of the metrics may take a while.