Fig. 8
Download original image
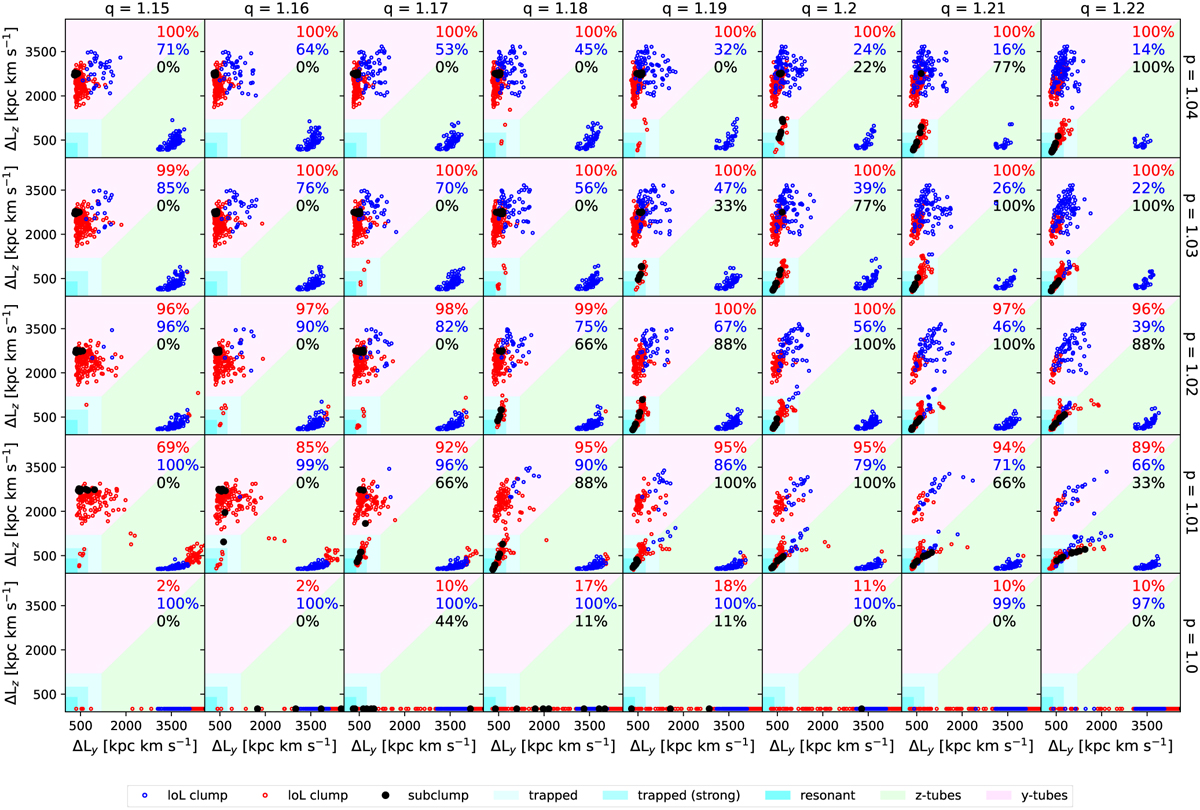
ΔLy and ΔLz calculated over an integration time of 100 Gyr for the orbits of the HS’ stars in a potential with a triaxial NFW halo for a range of 1.00 < p < 1.04 and 1.13 < q < 1.23. The hiL stars are plotted in red, the loL stars in blue, and the subclump stars in black. The percentages indicate how many percent of the hiL stars are on y-tube orbits or resonantly trapped orbits (red percentage), how many loL stars are on z-tube orbits (blue percentage), and how many subclump stars are strongly resonantly trapped (black percentage). The coloured backgrounds indicate regions occupied by different orbit families (see Eq. (9)): resonantly trapped orbits, strongly resonantly trapped orbits, and resonant orbits, in light blue, blue, and darker blue, y-tube orbits in pink, and z-tube orbits in green.
Current usage metrics show cumulative count of Article Views (full-text article views including HTML views, PDF and ePub downloads, according to the available data) and Abstracts Views on Vision4Press platform.
Data correspond to usage on the plateform after 2015. The current usage metrics is available 48-96 hours after online publication and is updated daily on week days.
Initial download of the metrics may take a while.