Fig. 3
Download original image
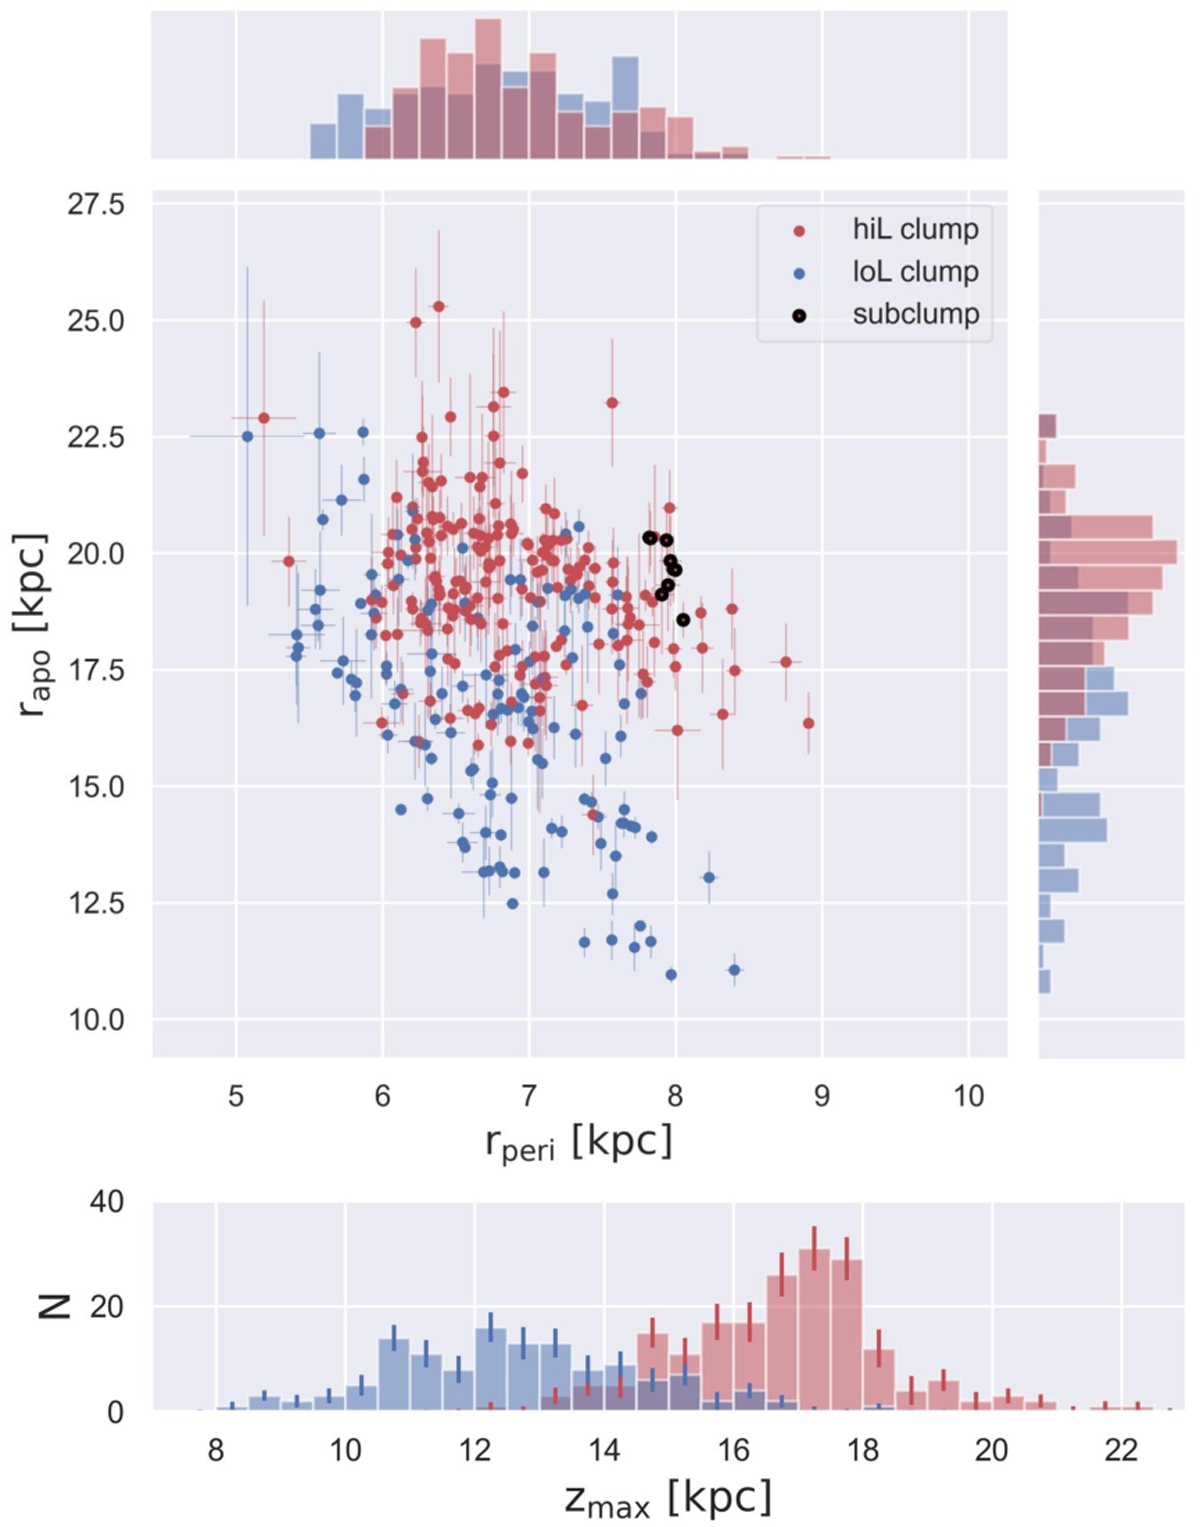
Pericentre, apocentre, and zmax distribution of the HS’ orbits in the fiducial potential (see Appendix A). The hiL stars are indicated in red, the loL stars in blue and the subclump with black edges as in Fig. 2. Histograms on the top and right of the top plot show the one-dimensional distributions. The apocentres and pericentres were determined as the maximum and minimum distance from the Galactic Centre that the orbit reached over an integration time of 10 Gyr. An estimate for the uncertainties was obtained by randomly sampling the observables a 1000 times within their uncertainties after integrating their orbits.
Current usage metrics show cumulative count of Article Views (full-text article views including HTML views, PDF and ePub downloads, according to the available data) and Abstracts Views on Vision4Press platform.
Data correspond to usage on the plateform after 2015. The current usage metrics is available 48-96 hours after online publication and is updated daily on week days.
Initial download of the metrics may take a while.