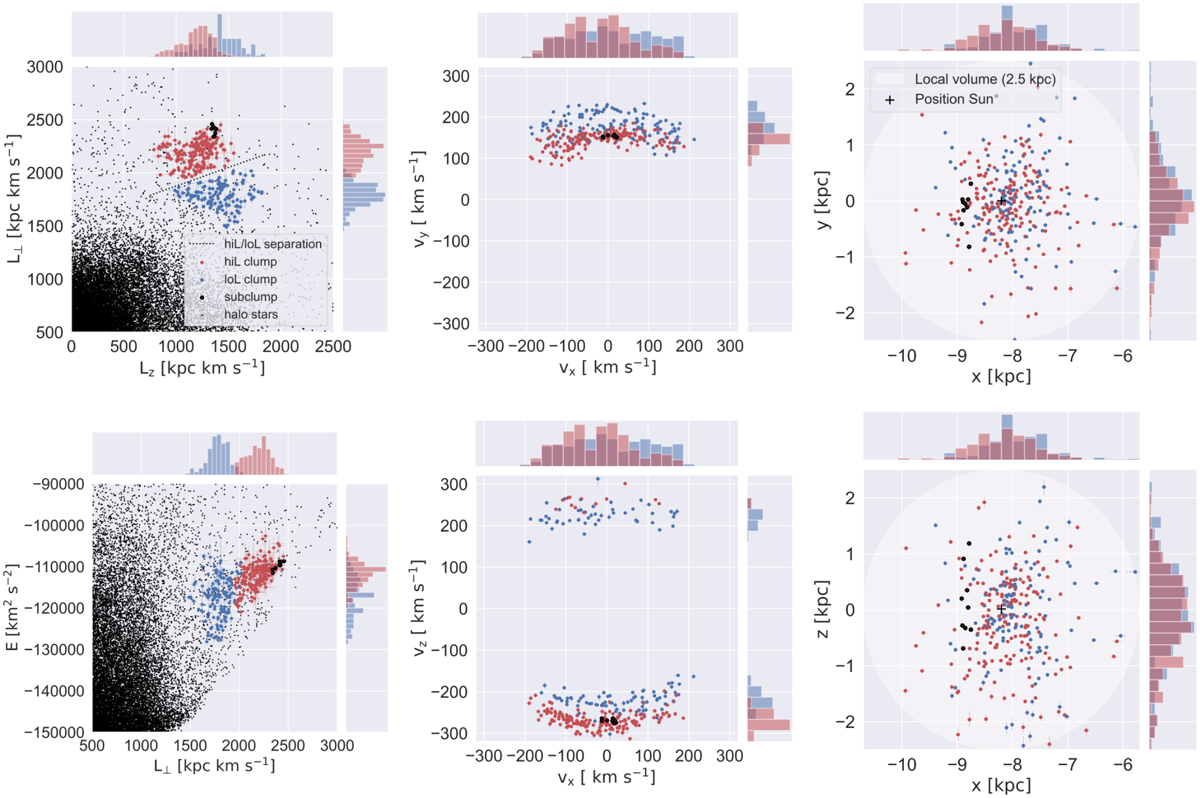
Fig. 2
Download original image
Distribution of the HS in IoM-space defined as E, Lz, and L⊥ (left), velocity (middle), and configuration space (right) separated in the hiL clump (red, 191 stars in total) and loL clump (blue, 128 stars in total) based on the stars’ position in (Lz, L⊥) space, see top-left panel. The subclump, a kinematically cold, coherent group of stars, is indicated in black. The stars in the background of the energy and angular momentum distributions correspond to the selection of local halo stars (d < 2.5 kpc) by Dodd et al. (2023). The energy values have been computed in the fiducial potential (see Appendix A). Histograms on the top and right of each plot show the one-dimensional distributions. The error bars on the data points denote the uncertainties. The hiL clump has on average lower Lz, higher L⊥, higher energy, larger |vz| and lower vy.
Current usage metrics show cumulative count of Article Views (full-text article views including HTML views, PDF and ePub downloads, according to the available data) and Abstracts Views on Vision4Press platform.
Data correspond to usage on the plateform after 2015. The current usage metrics is available 48-96 hours after online publication and is updated daily on week days.
Initial download of the metrics may take a while.