Fig. A.1
Download original image
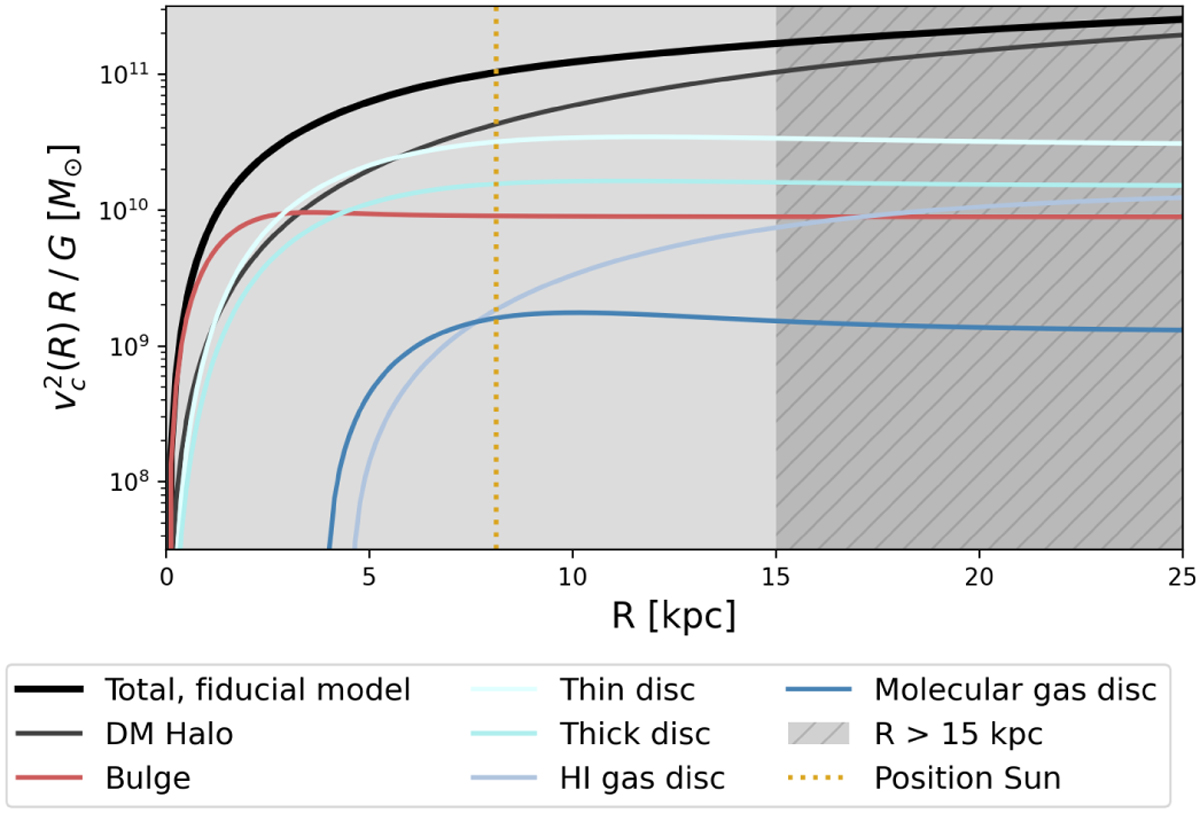
![]() for the fiducial potential model and its different components individually. This quantity can be taken as a proxy for the mass enclosed within a certain radius R, and this plot thus gives a feeling for the relative importance of each component at different radii on the midplane. The orbits of the HS stars reach between 5 - 20 kpc (see Fig. 3), and in this range the DM halo dominates. The grey hatched area marks the region R > 15 kpc and data in this distance range was not included in the MCMC fit.
for the fiducial potential model and its different components individually. This quantity can be taken as a proxy for the mass enclosed within a certain radius R, and this plot thus gives a feeling for the relative importance of each component at different radii on the midplane. The orbits of the HS stars reach between 5 - 20 kpc (see Fig. 3), and in this range the DM halo dominates. The grey hatched area marks the region R > 15 kpc and data in this distance range was not included in the MCMC fit.
Current usage metrics show cumulative count of Article Views (full-text article views including HTML views, PDF and ePub downloads, according to the available data) and Abstracts Views on Vision4Press platform.
Data correspond to usage on the plateform after 2015. The current usage metrics is available 48-96 hours after online publication and is updated daily on week days.
Initial download of the metrics may take a while.