Fig. 15
Download original image
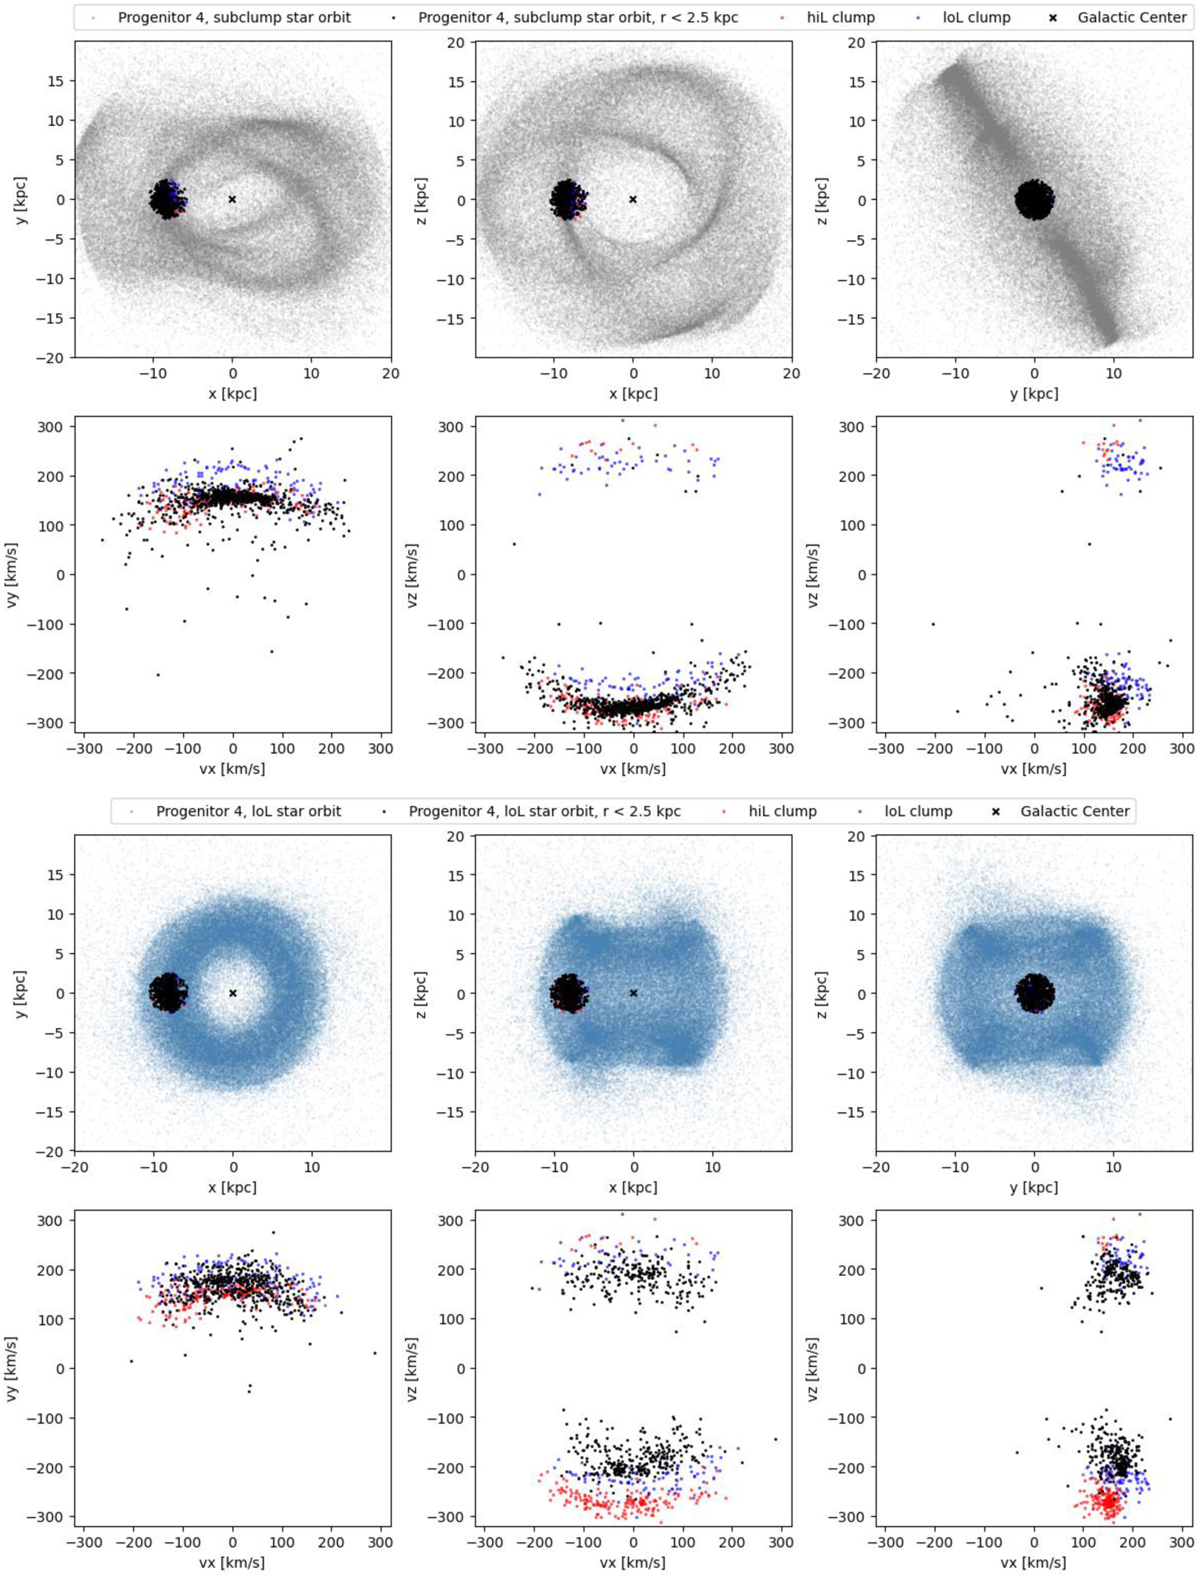
Phase space distribution of Progenitor 4 by Koppelman et al. (2019b) on two different orbits after 8 Gyr of integration time in a potential with p = 1.02, q = 1.19. Particles within a local volume selection, that is, d < 2.5 kpc, are shown in black. For comparison, the hiL and loL HS stars are shown in red and blue, respectively. The top two rows show the particles of Progenitor 4 at the present day after it has been re-centred and integrated forward from the 6 D phase-space coordinate of a subclump star 8 Gyr ago, which is resonantly trapped on the Ωϕ:Ωz = 1:1 resonance. Consequently, a large part of the Progenitor 4 particles is resonantly trapped, as is evident from the substructure in configuration space, the flattened particle distribution in the (y, z) plane and the low ![]() ratio. The bottom two rows show particles of Progenitor 4 at the present day after it has been re-centred and integrated forward from the 6 D phase-space coordinate of a loL star 8 Gyr ago, which is on a z-tube orbit. The particles appear more mixed, as they show less substructure in configuration space, have a more diffuse velocity distribution and a higher
ratio. The bottom two rows show particles of Progenitor 4 at the present day after it has been re-centred and integrated forward from the 6 D phase-space coordinate of a loL star 8 Gyr ago, which is on a z-tube orbit. The particles appear more mixed, as they show less substructure in configuration space, have a more diffuse velocity distribution and a higher ![]() ratio.
ratio.
Current usage metrics show cumulative count of Article Views (full-text article views including HTML views, PDF and ePub downloads, according to the available data) and Abstracts Views on Vision4Press platform.
Data correspond to usage on the plateform after 2015. The current usage metrics is available 48-96 hours after online publication and is updated daily on week days.
Initial download of the metrics may take a while.