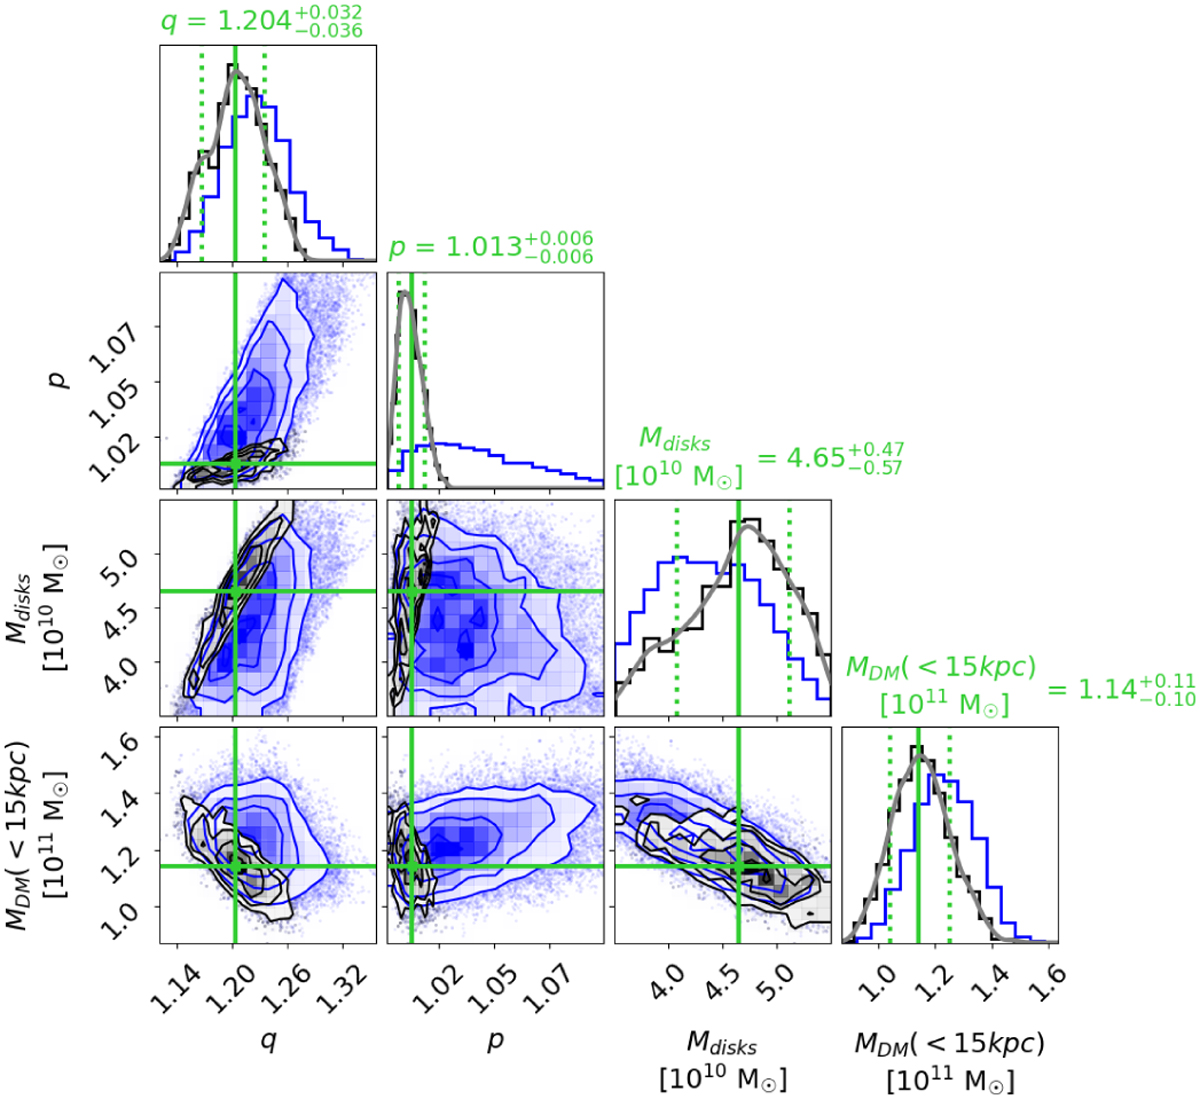
Fig. 11
Download original image
Posterior distribution of the parameters q, p, Mdiscs, and MDM(<15 kpc) that maximises the number of subclump stars on strongly resonantly trapped orbits and fits the rotation curve data by Eilers et al. (2019) and Zhou et al. (2023), in blue. MCMC steps of walkers that got stuck have been removed. The posterior parameter distribution shown in black corresponds to potentials in which at least 40% of the loL stars are on z-tube orbits. The peak value of this distribution, which we take as our best estimate, is indicated in green solid lines in all panels, and was determined using a kernel-density estimation. The 31.73% (68.27%) percentile of the data lower (higher) than the peak value is taken as the lower (upper) 1σ uncertainty and are indicated with dotted green lines in the panels showing histograms of the marginalised distributions. The grey lines in those same panels show the kernel-density estimation of the marginalised distributions.
Current usage metrics show cumulative count of Article Views (full-text article views including HTML views, PDF and ePub downloads, according to the available data) and Abstracts Views on Vision4Press platform.
Data correspond to usage on the plateform after 2015. The current usage metrics is available 48-96 hours after online publication and is updated daily on week days.
Initial download of the metrics may take a while.