Fig. 1
Download original image
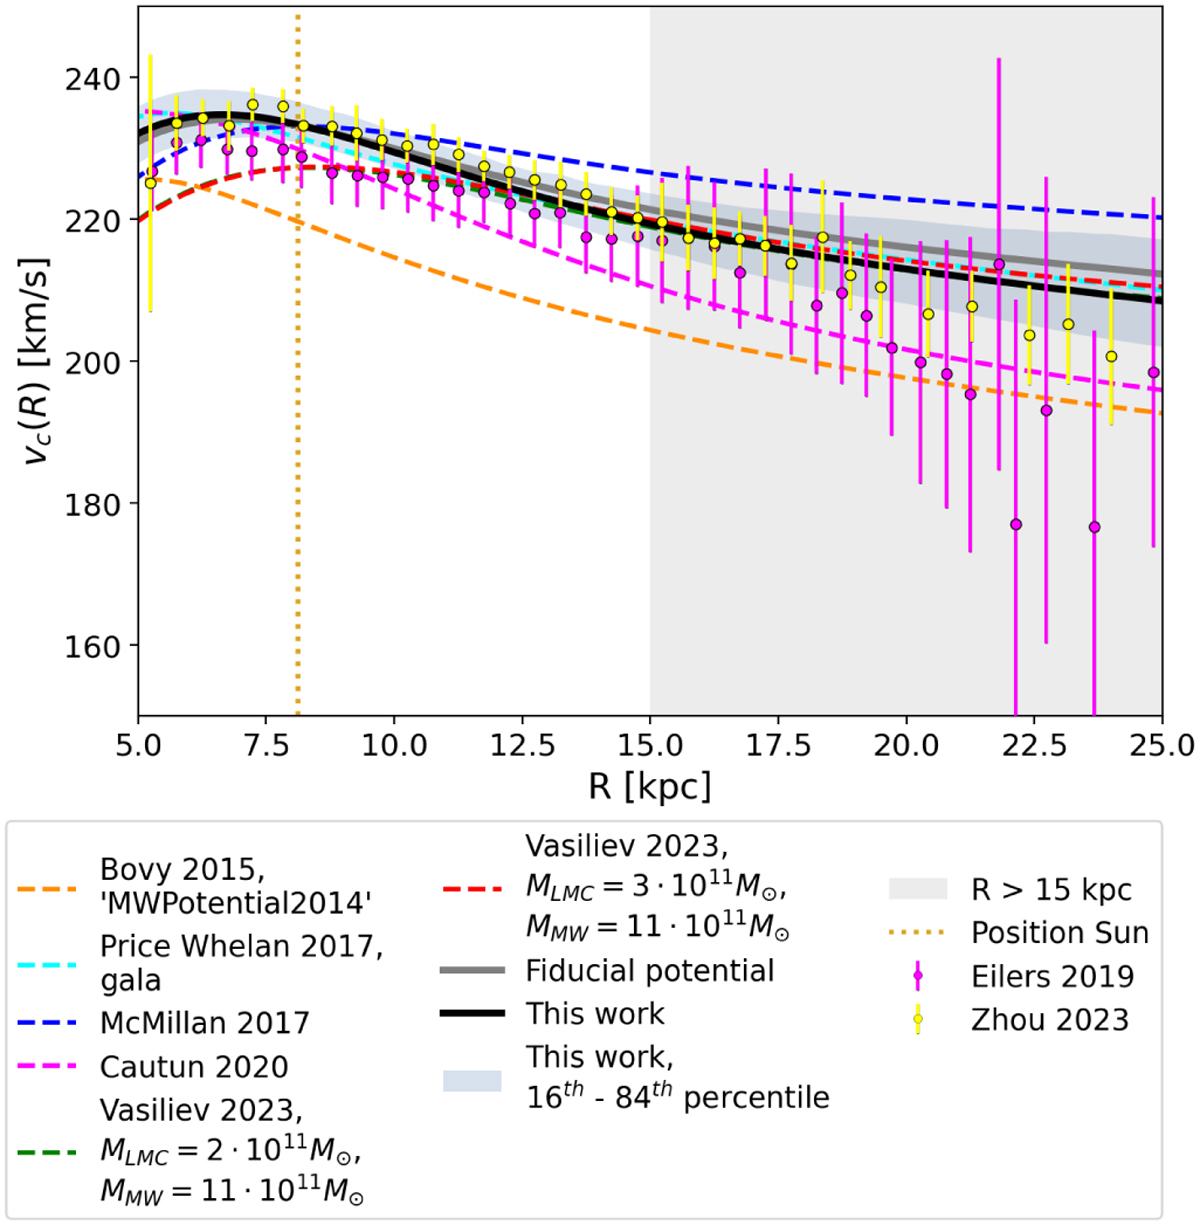
Rotation curves of a variety of MW mass models. We have plotted here the models by Bovy (2015), Price-Whelan (2017), McMillan (2017), and Cautun et al. (2020), and two models by Vasiliev (2024) using his ℒ3, ℳ11 and ℒ2, ℳ11 halo models at the present day. The grey line shows the rotation curve of the fiducial model (described in Sect. 2.1 and Appendix A). The black line shows the best-fit potential of this work (described in Sect. 4.2), while the grey shaded area correspond to the 16th to 84th percentile range for 200 potentials from the MCMC chains. The rotation curve data used in the fit includes Eilers et al. (2019)’s rotation curve data, shown in magenta, and Zhou et al. (2023)’s in yellow. The light grey shaded area marks the region R > 15 kpc and data in this distance range was not included in the MCMC fit. However, the fit is similar even if data up to R ~ 20 kpc is used.
Current usage metrics show cumulative count of Article Views (full-text article views including HTML views, PDF and ePub downloads, according to the available data) and Abstracts Views on Vision4Press platform.
Data correspond to usage on the plateform after 2015. The current usage metrics is available 48-96 hours after online publication and is updated daily on week days.
Initial download of the metrics may take a while.