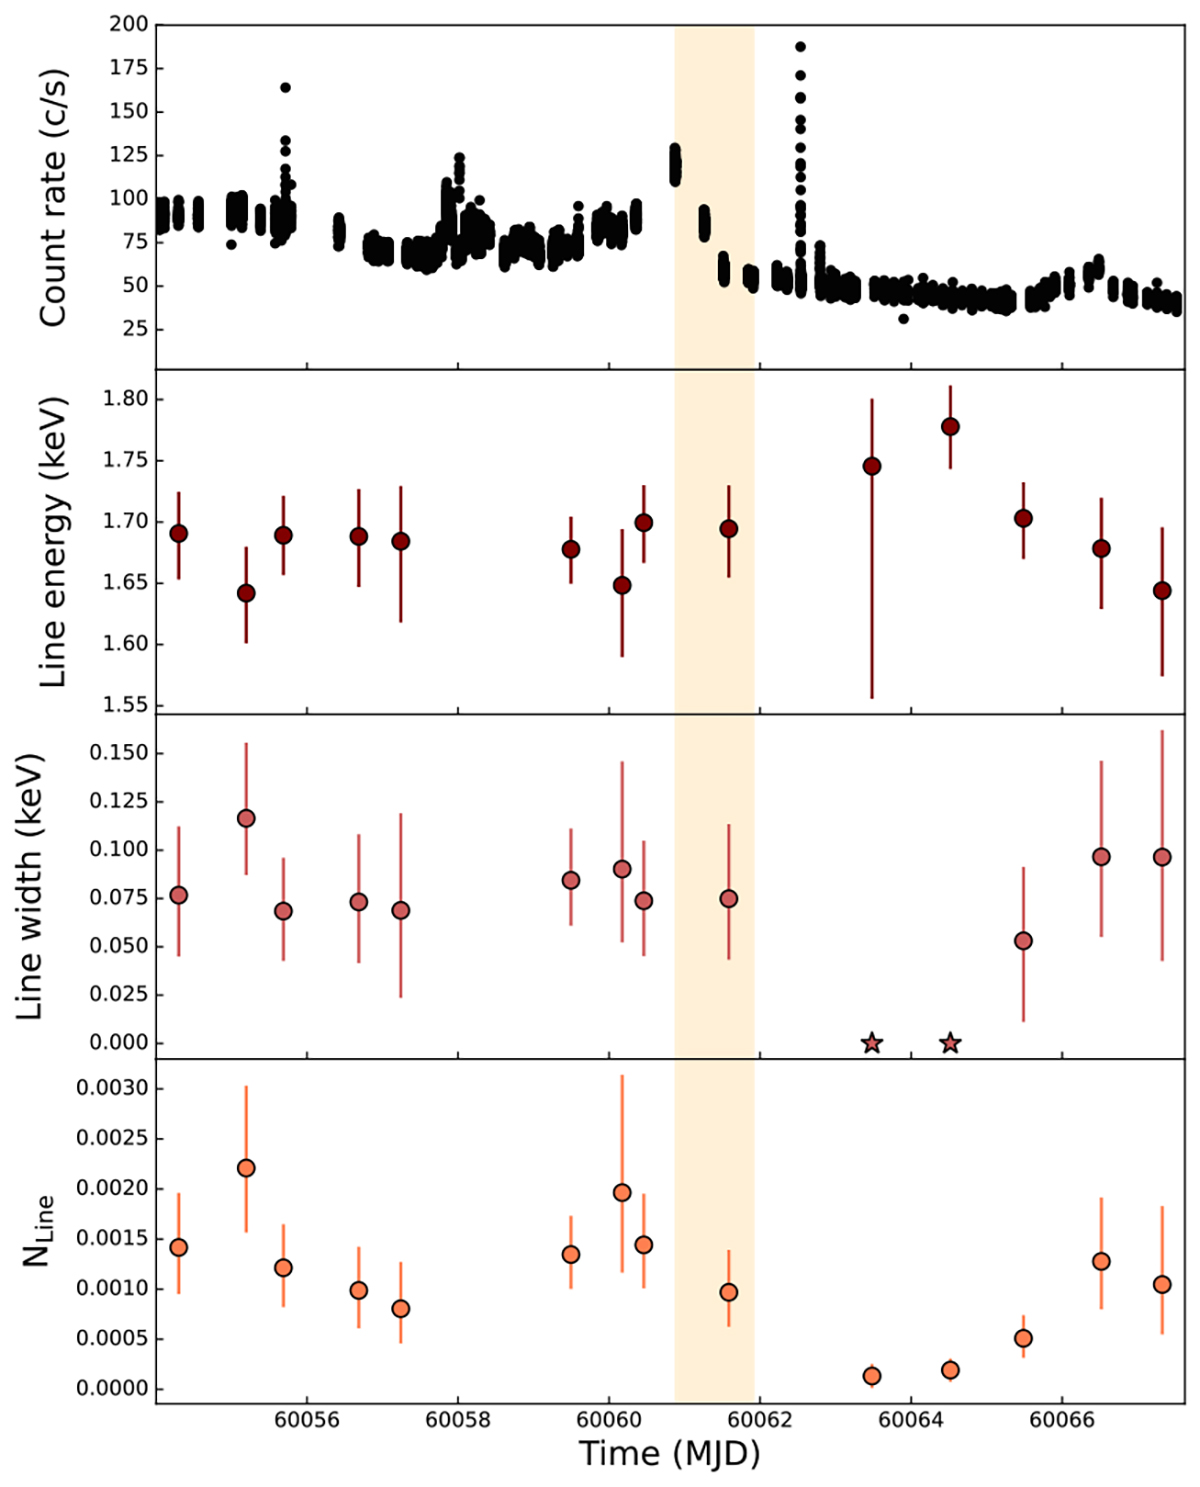
Fig. 4.
Download original image
Temporal evolution of the likely Si fluorescence line at ∼1.7 keV. The top panel shows the 0.5–10 keV light curve. The associated uncertainties are reported at a level of statistical confidence of 90 percent. Star-shaped points represent fixed values for the parameters. The spectral parameters are reported in Table B.3. The yellow-shaded region indicates the time interval in which the phase jump occurs (see Sect. 3.3).
Current usage metrics show cumulative count of Article Views (full-text article views including HTML views, PDF and ePub downloads, according to the available data) and Abstracts Views on Vision4Press platform.
Data correspond to usage on the plateform after 2015. The current usage metrics is available 48-96 hours after online publication and is updated daily on week days.
Initial download of the metrics may take a while.