Fig. 7.
Download original image
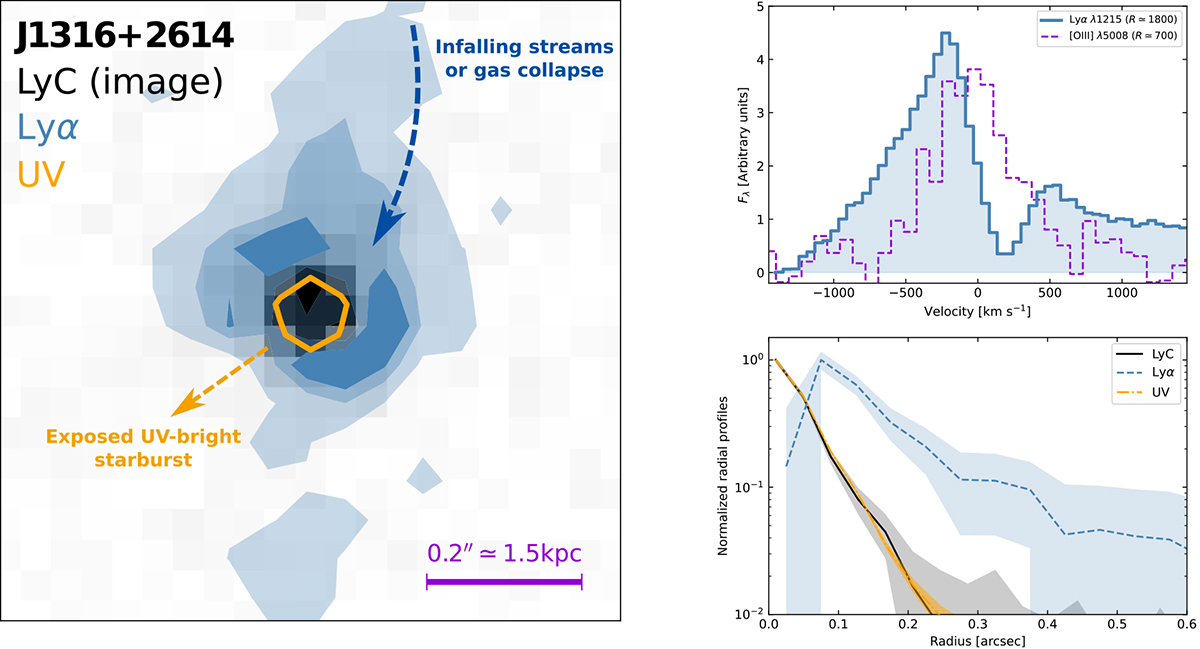
LyC emission of J1316+2614 from the HST/F410M image (0.8″ × 0.8″; north is up, and east is to the left). The continuum-subtracted Lyα emission is shown in blue with three contours representing the 2.5σ − 5σ, 5σ − 8σ, and 8σ − 15σ levels. The emission from the non-ionising UV (F775W, λ0 ≃ 1650 Å) is represented in orange and has a size corresponding to its observed FWHM (≃0.09″). Top right: GTC optical and near-IR spectra analysed in Marques-Chaves et al. (2022), highlighting the Lyαλ1216 Å (blue) and [O III] λ5008 Å (violet) spectral profile at rest velocities. Bottom right: Normalised (to their maxima) radial profiles obtained for the LyC (black), UV (orange), and Lyα emission (blue).
Current usage metrics show cumulative count of Article Views (full-text article views including HTML views, PDF and ePub downloads, according to the available data) and Abstracts Views on Vision4Press platform.
Data correspond to usage on the plateform after 2015. The current usage metrics is available 48-96 hours after online publication and is updated daily on week days.
Initial download of the metrics may take a while.