Fig. 4.
Download original image
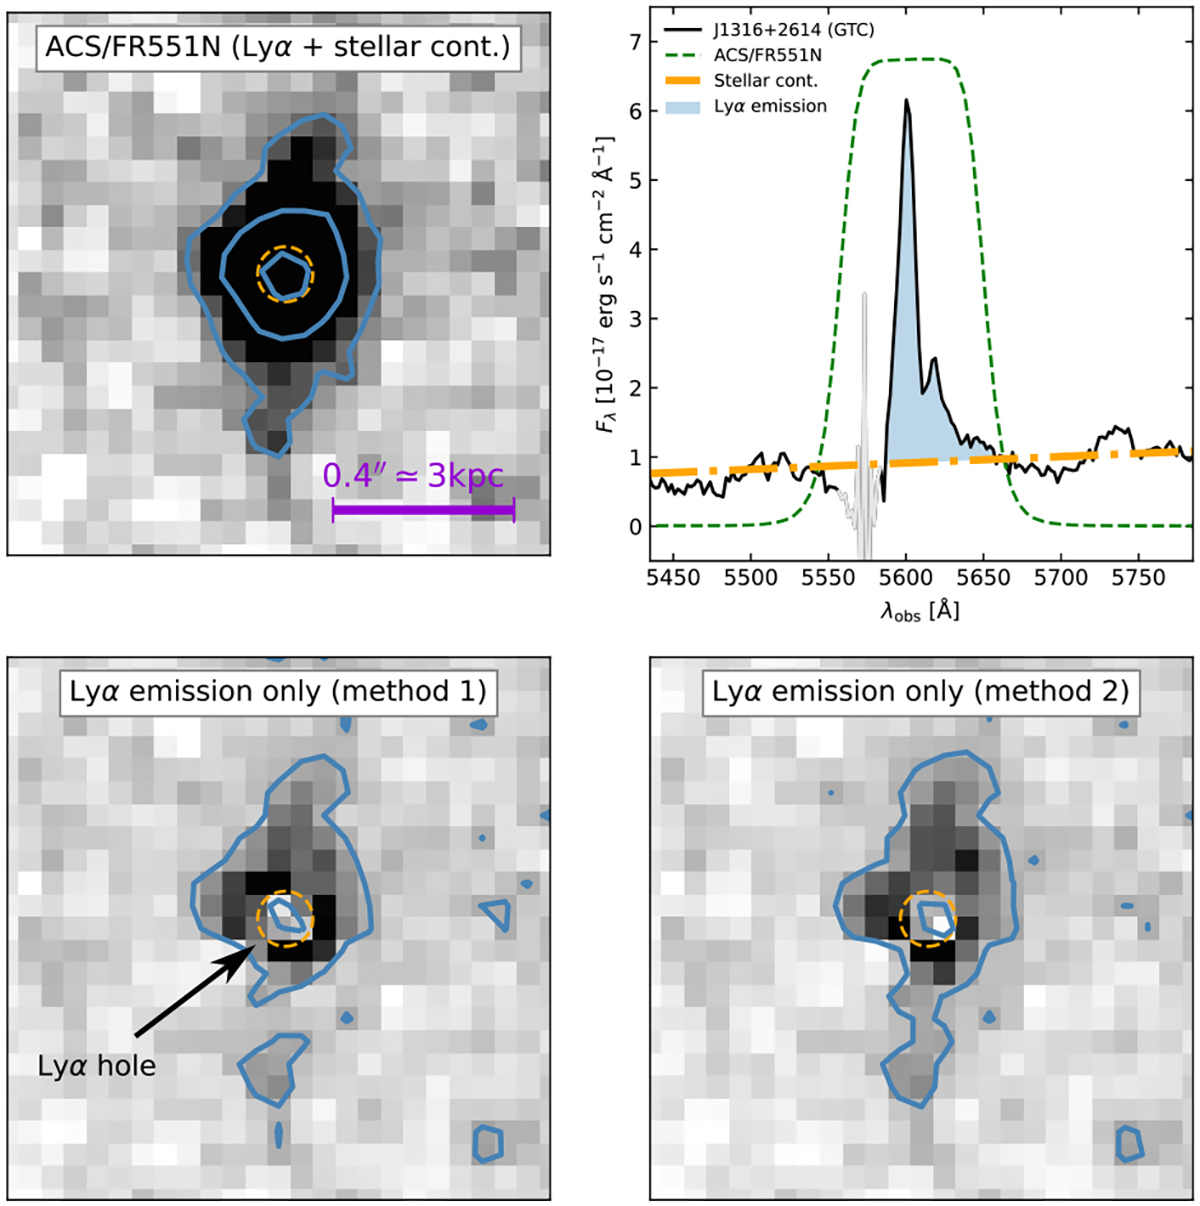
Lyα spatial distribution of J1316+2614. Top left: Cutout images of J1316+2614 in the ACS/HST ramp-filter FR551N (with a total size of 1.2″ × 1.2″; north is up, and east to the left), which includes the Lyα emission and the underlying stellar continuum (blue contours mark the 3σ, 15σ, and 50σ emission). The dashed orange circle represents the position and total size of the stellar continuum as measured in the F775W and deconvolved with the PSF (i.e. a radius of 2 × reff ≃ 0.06″). Top right: GTC spectrum of J1316+2614 (black; Marques-Chaves et al. 2022) and the FR551N transmission curve (dashed green). The dashed-dotted orange line represents our best fit of the stellar continuum around the Lyα emission (blue). Bottom panels: FR551N images continuum-subtracted using two different methods (see the main text). Lyα appears residual within the UV-bright stellar clump (orange) and is predominantly emitted in the outskirts. The blue contours mark the 2.5σ level.
Current usage metrics show cumulative count of Article Views (full-text article views including HTML views, PDF and ePub downloads, according to the available data) and Abstracts Views on Vision4Press platform.
Data correspond to usage on the plateform after 2015. The current usage metrics is available 48-96 hours after online publication and is updated daily on week days.
Initial download of the metrics may take a while.