Open Access
Fig. 6.
Download original image
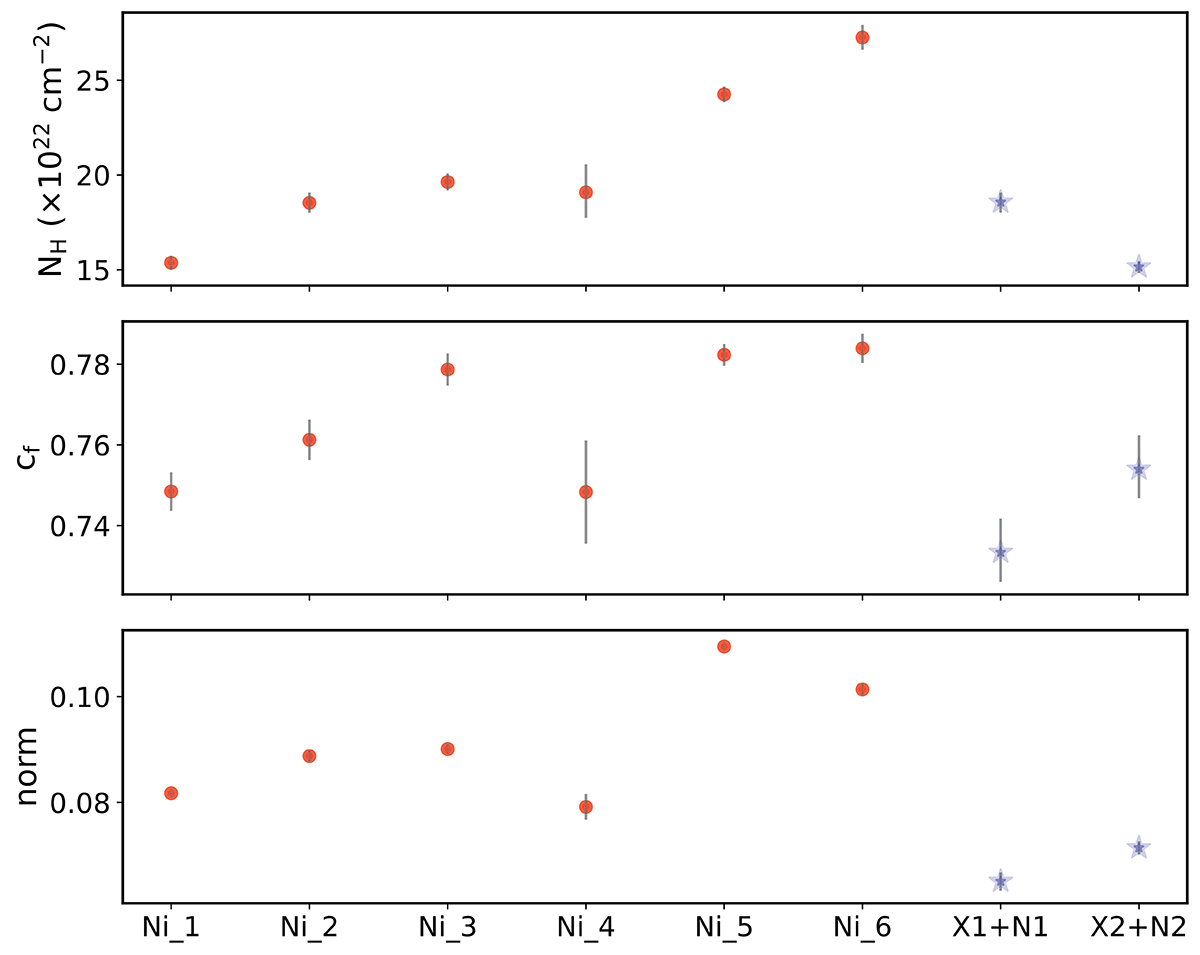
Spectral parameter variability. We show the variations of the column density (upper panel) and covering factor (middle panel) of the first neutral partial covering along with those of the primary continuum normalization (lower panel) for the NICER data (red dots) and for XMM+NuSTAR (blue stars).
Current usage metrics show cumulative count of Article Views (full-text article views including HTML views, PDF and ePub downloads, according to the available data) and Abstracts Views on Vision4Press platform.
Data correspond to usage on the plateform after 2015. The current usage metrics is available 48-96 hours after online publication and is updated daily on week days.
Initial download of the metrics may take a while.