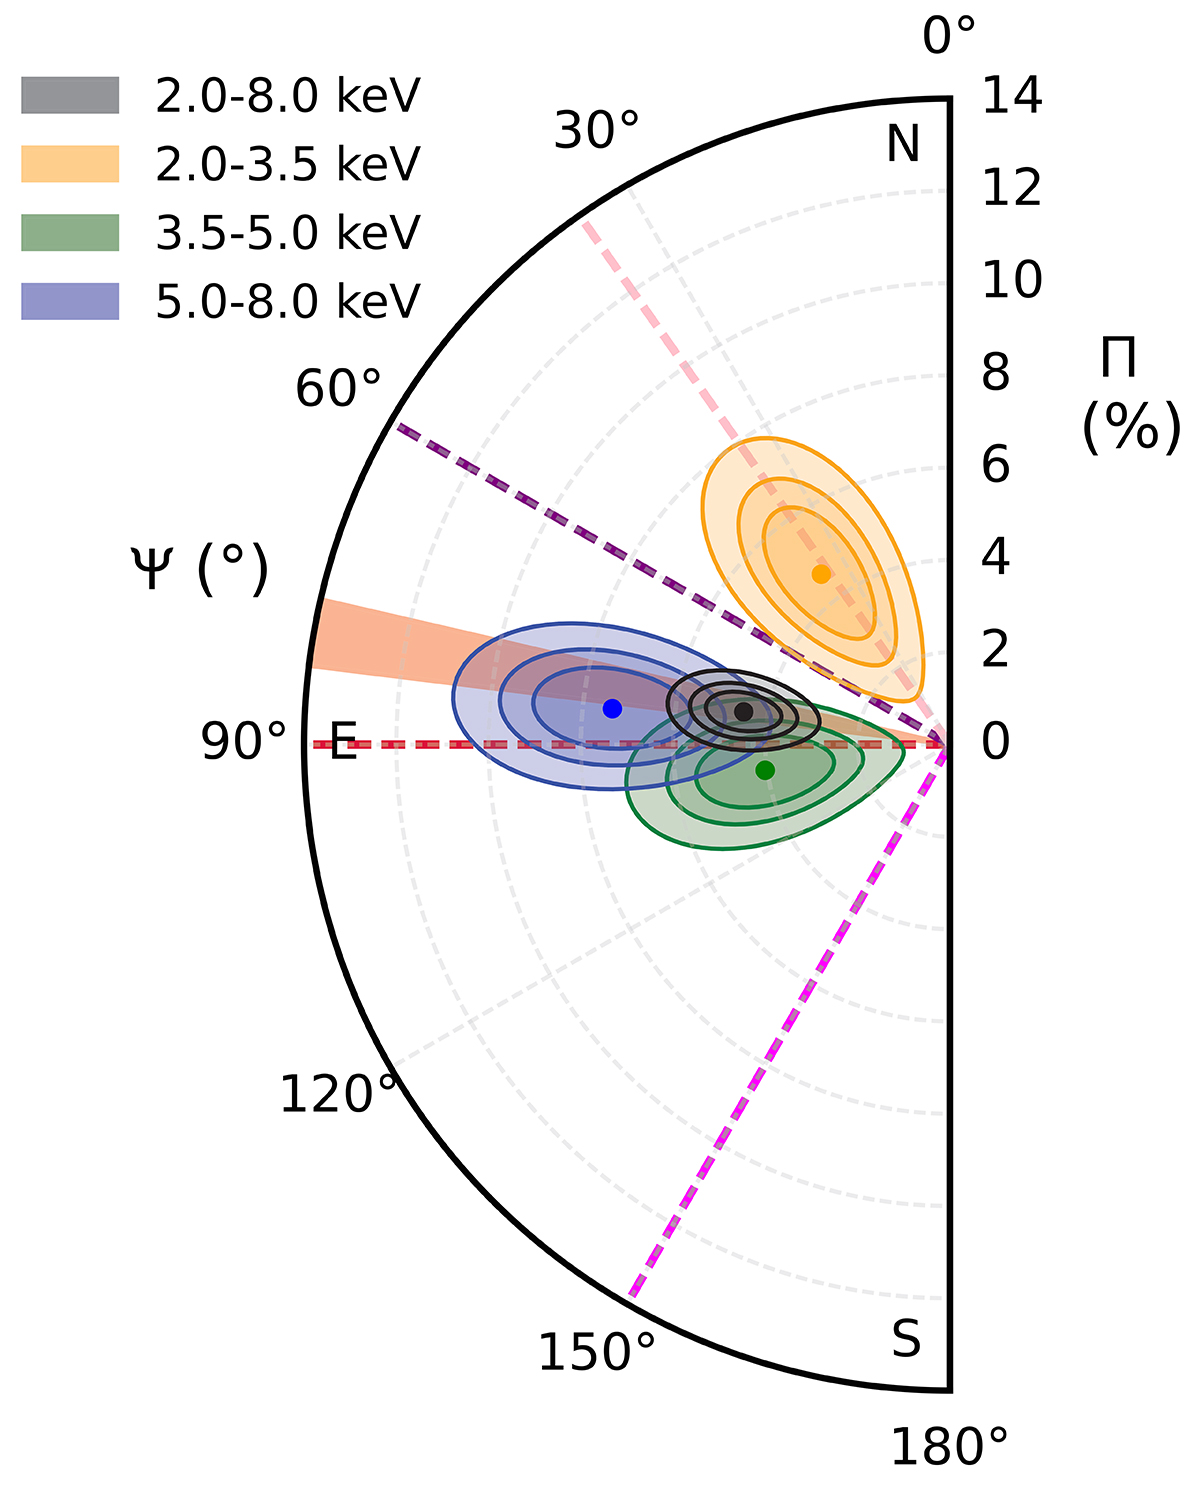
Fig. 2.
Download original image
First and second IXPE observations combined. Polarization contours (68, 90, and 99% c.ls.) for the PD Π and the PA Ψ with respect to the north direction. Colors refer to the 2.0–8.0 keV (in black), 2.0–3.5 keV (in yellow), 3.5–5.0 keV (in green), and 5.0–8.0 keV (in blue) energy ranges, respectively. The orange region shows the direction of the radio emission. The red, purple, and pink dashed lines represent the direction of the inner few pc of the radio jet, the narrow-line region, and an unclassified feature, respectively (see Sect. 4). The magenta dashed line shows the direction of the torus, which has been identified in X-rays with a position angle of ∼150° (Wang et al. 2011), appearing to coincide with the H2 region identified by Storchi-Bergmann et al. (2009). It is worth noting that the accretion disk axis could be misaligned with the torus by ∼20° (May et al. 2020). Furthermore, Bentz et al. (2022) describe the broad-line region as a thick disk with a ∼57° opening angle and a ∼58° inclination angle, suggesting our view skims just above the broad-line region surface.
Current usage metrics show cumulative count of Article Views (full-text article views including HTML views, PDF and ePub downloads, according to the available data) and Abstracts Views on Vision4Press platform.
Data correspond to usage on the plateform after 2015. The current usage metrics is available 48-96 hours after online publication and is updated daily on week days.
Initial download of the metrics may take a while.