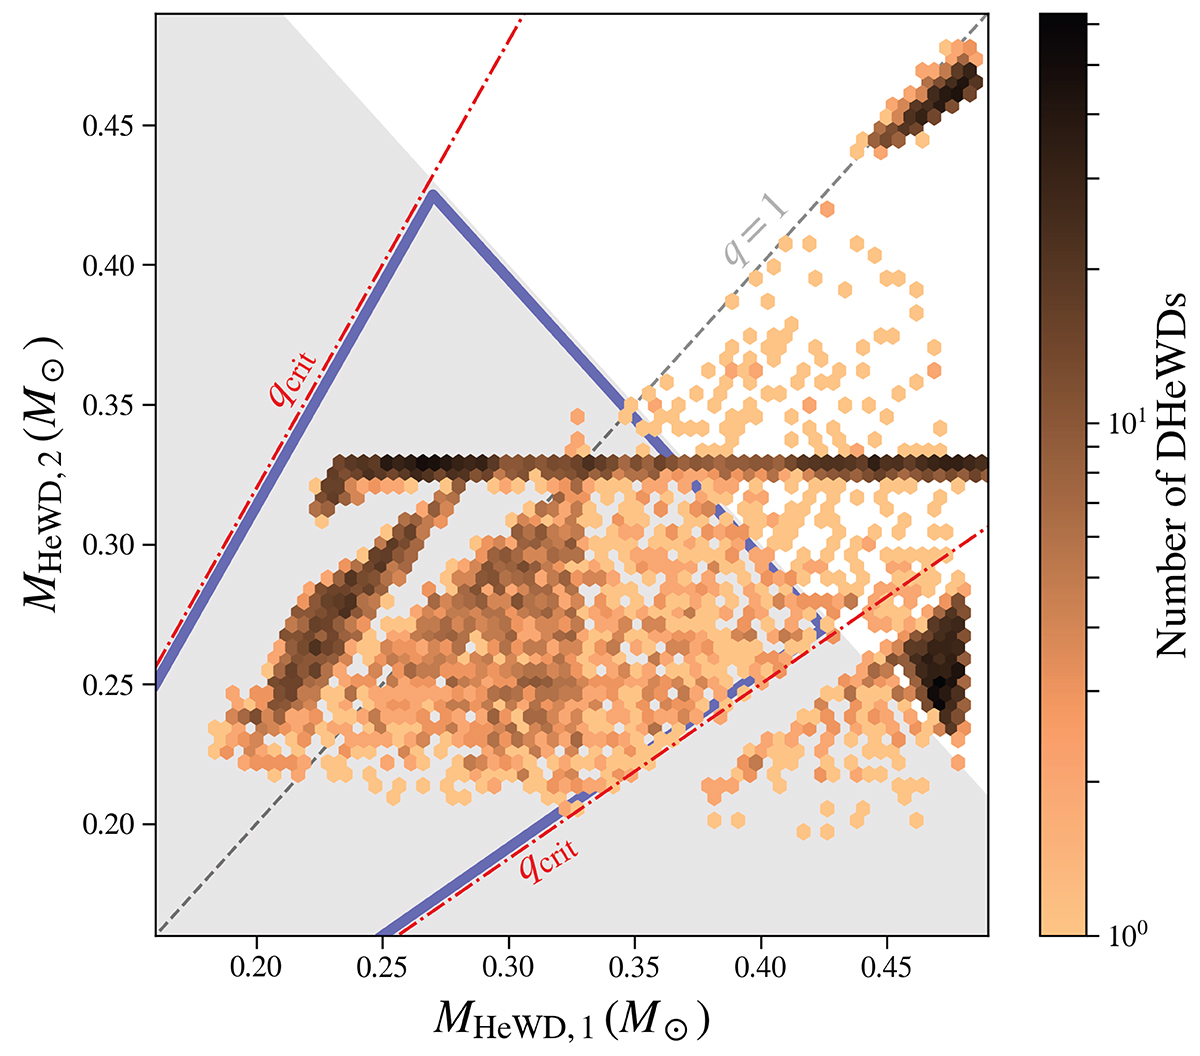
Fig. 6.
Download original image
Number of DHeWDs (colour-coded) from our binary population synthesis on the mass-mass plane. Index ‘1’ corresponds to the component that was more massive on the MS, and index ‘2’ corresponds to the less massive component. The grey dashed line corresponds to equal component masses. The red dotted-dashed lines surround the area where the mass ratio of the components allows for a merger, q > qcrit = 0.625. The grey shaded area corresponds to the sum of the masses of the components smaller than 0.7 M⊙. The blue polygon encloses the region with systems that may be progenitors of BLAPs.
Current usage metrics show cumulative count of Article Views (full-text article views including HTML views, PDF and ePub downloads, according to the available data) and Abstracts Views on Vision4Press platform.
Data correspond to usage on the plateform after 2015. The current usage metrics is available 48-96 hours after online publication and is updated daily on week days.
Initial download of the metrics may take a while.