Fig. 3.
Download original image
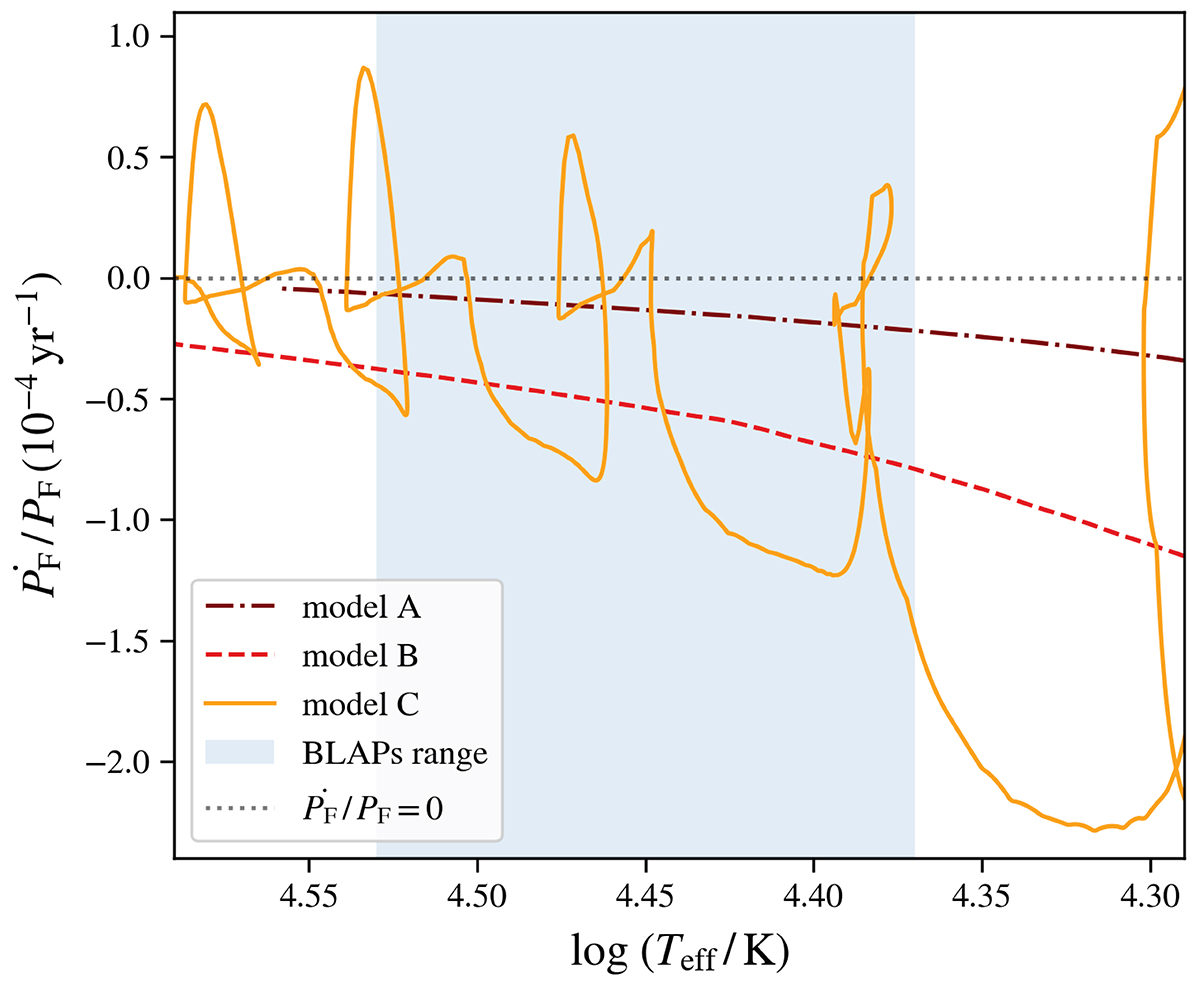
Evolution of the rate of change of the pulsation period of the fundamental radial mode, normalised to its instantaneous value, for models A (dashed-dotted curve), B (dashed curve), and C (solid curve) with an initial Z = 0.02 as a function of effective temperature. The shaded vertical region indicates the observed effective temperature range of the BLAPs. The dotted horizontal line indicates no change in period. The abscissa axis has been inverted to correspond to the H-R diagram; hence, time flows from right to left in the figure. Negative values on the ordinate axis indicate a shortening of the pulsation period, while positive values indicate a lengthening.
Current usage metrics show cumulative count of Article Views (full-text article views including HTML views, PDF and ePub downloads, according to the available data) and Abstracts Views on Vision4Press platform.
Data correspond to usage on the plateform after 2015. The current usage metrics is available 48-96 hours after online publication and is updated daily on week days.
Initial download of the metrics may take a while.