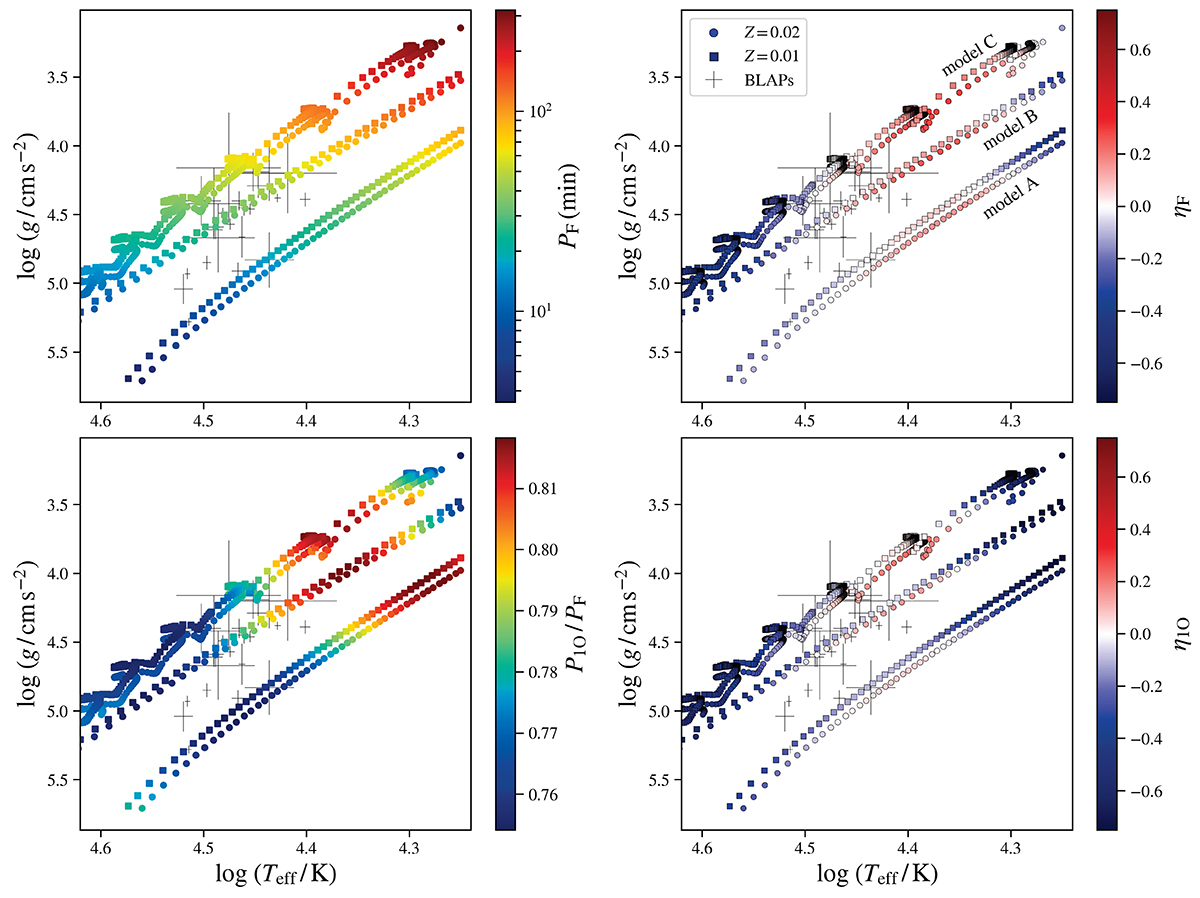
Fig. 2.
Download original image
Evolution of the seismic properties of the post-merger models A, B, and C (colour-coded points) in the Kiel diagrams as they pass the BLAP region. Colour-coded circles correspond to models with initial metallicity Z = 0.02, while squares correspond to Z = 0.01. The black crosses indicate the position of the BLAPs based on the same data as in Fig. 1. The colour scales in the panels correspond to the pulsation period of the fundamental radial mode (upper left), the normalised growth rate of this mode (upper right), the period ratio of the first radial overtone to the fundamental radial mode (lower left) and the normalised growth rate of the first overtone (lower right).
Current usage metrics show cumulative count of Article Views (full-text article views including HTML views, PDF and ePub downloads, according to the available data) and Abstracts Views on Vision4Press platform.
Data correspond to usage on the plateform after 2015. The current usage metrics is available 48-96 hours after online publication and is updated daily on week days.
Initial download of the metrics may take a while.