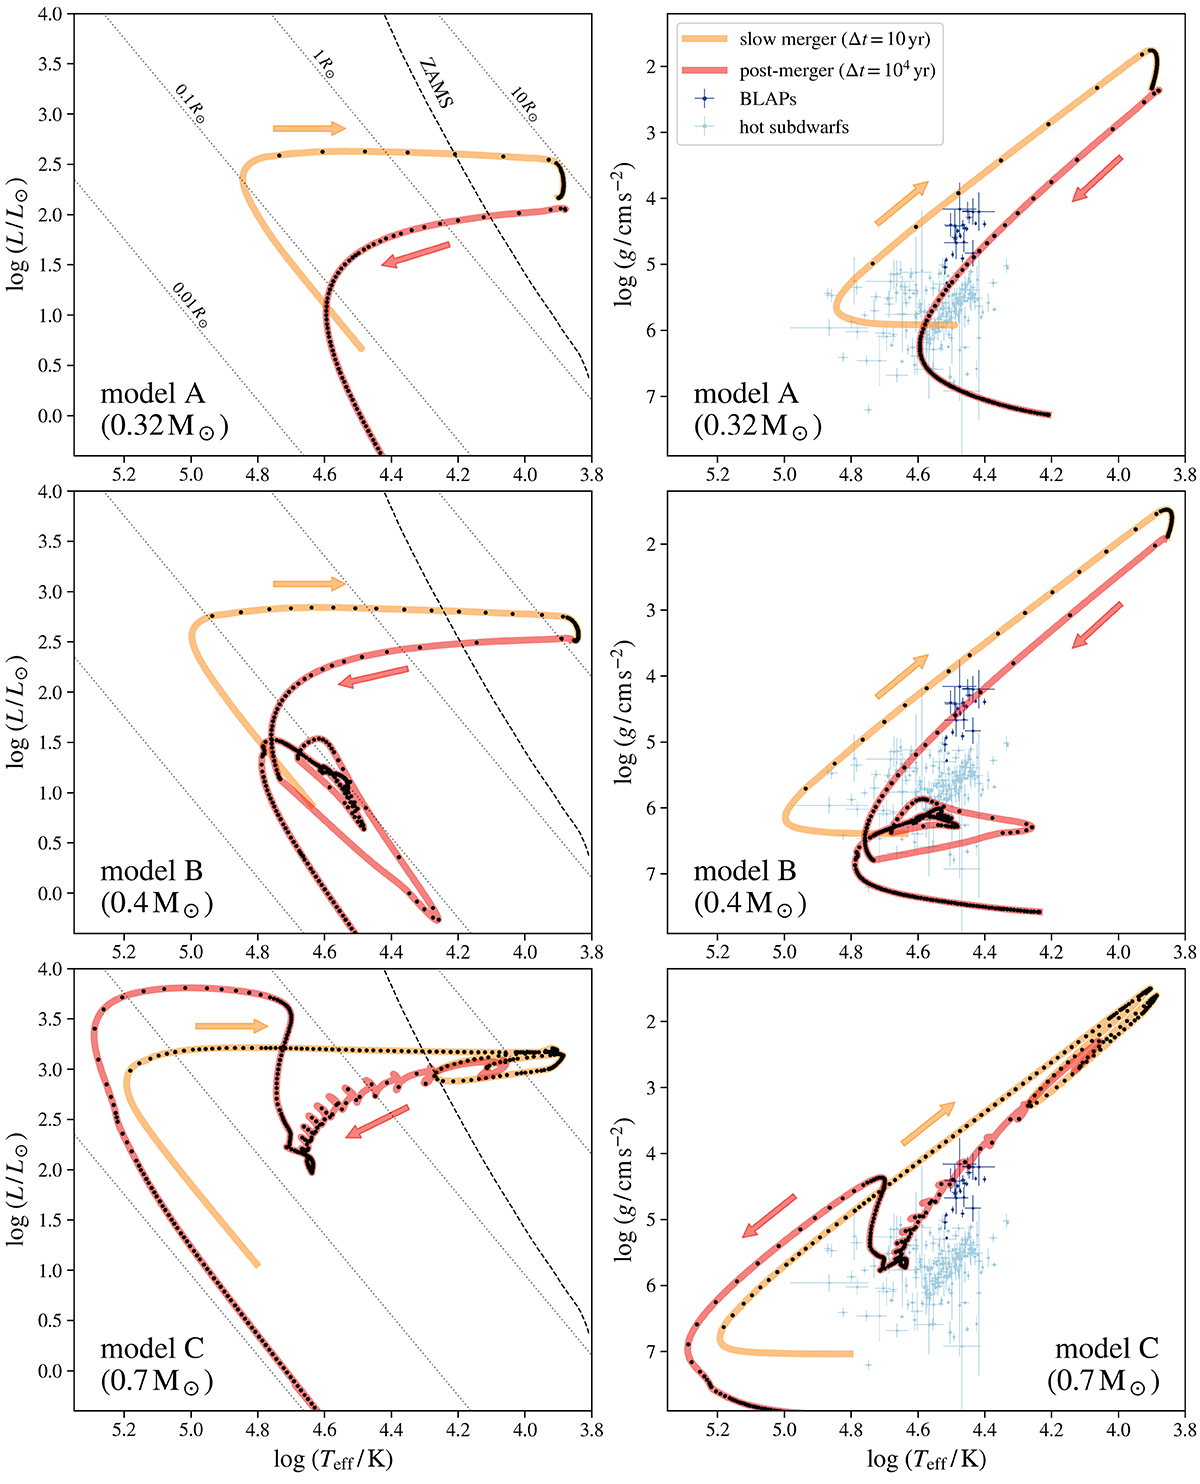
Fig. 1.
Download original image
Evolutionary tracks for the models A (top row), B (middle row), and C (bottom row) with the initial metallicity Z = 0.02 in the H-R diagrams (left column) and Kiel diagrams (right column). The orange curves represent the evolution of the model during the slow merger phase, while the red curve corresponds to the evolution of the post-merger product. The black dots along the evolutionary tracks indicate fixed time intervals with the periods provided in the legend. Arrows indicate the direction of evolution at both stages. The dashed curve in the H-R diagrams corresponds to ZAMS. The diagonal dotted lines in the H-R diagrams correspond to the lines of constant radii and are labelled in the top right panel. For comparison, the dark blue and light blue points with error bars correspond to the observed parameters of BLAPs and hot subdwarfs, respectively. Data sources for them are given in the text.
Current usage metrics show cumulative count of Article Views (full-text article views including HTML views, PDF and ePub downloads, according to the available data) and Abstracts Views on Vision4Press platform.
Data correspond to usage on the plateform after 2015. The current usage metrics is available 48-96 hours after online publication and is updated daily on week days.
Initial download of the metrics may take a while.