Fig. 3.
Download original image
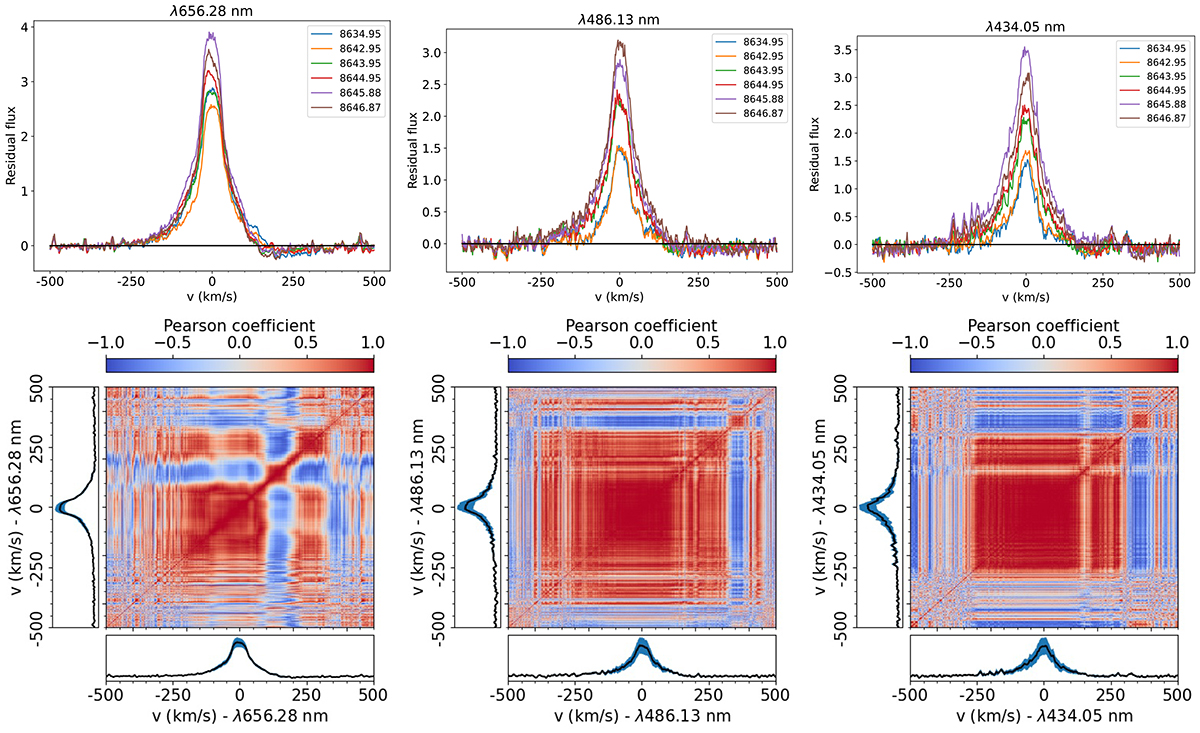
Variability of the 2019 Balmer lines of EX Lup. Top row: Hα(left), Hβ(middle), and Hγ(right) residual lines profiles. Each colour represents a different observation. Bottom row: Hα(left), Hβ(middle), and Hγ(right) residual line auto-correlation matrices. The colour-code scales the correlation coefficient. Light yellow represents a strong correlation, and dark purple shows a strong anti-correlation. The strong anti-correlation around +350 km s−1 in the Hβ and Hγ matrices is probably an artefact because it is located in a part of the continuum that varies very little.
Current usage metrics show cumulative count of Article Views (full-text article views including HTML views, PDF and ePub downloads, according to the available data) and Abstracts Views on Vision4Press platform.
Data correspond to usage on the plateform after 2015. The current usage metrics is available 48-96 hours after online publication and is updated daily on week days.
Initial download of the metrics may take a while.